29
/es/
es
AIzaSyAYiBZKx7MnpbEhh9jyipgxe19OcubqV5w
April 1, 2024
124144
Ecuador
ECU
true
2
1
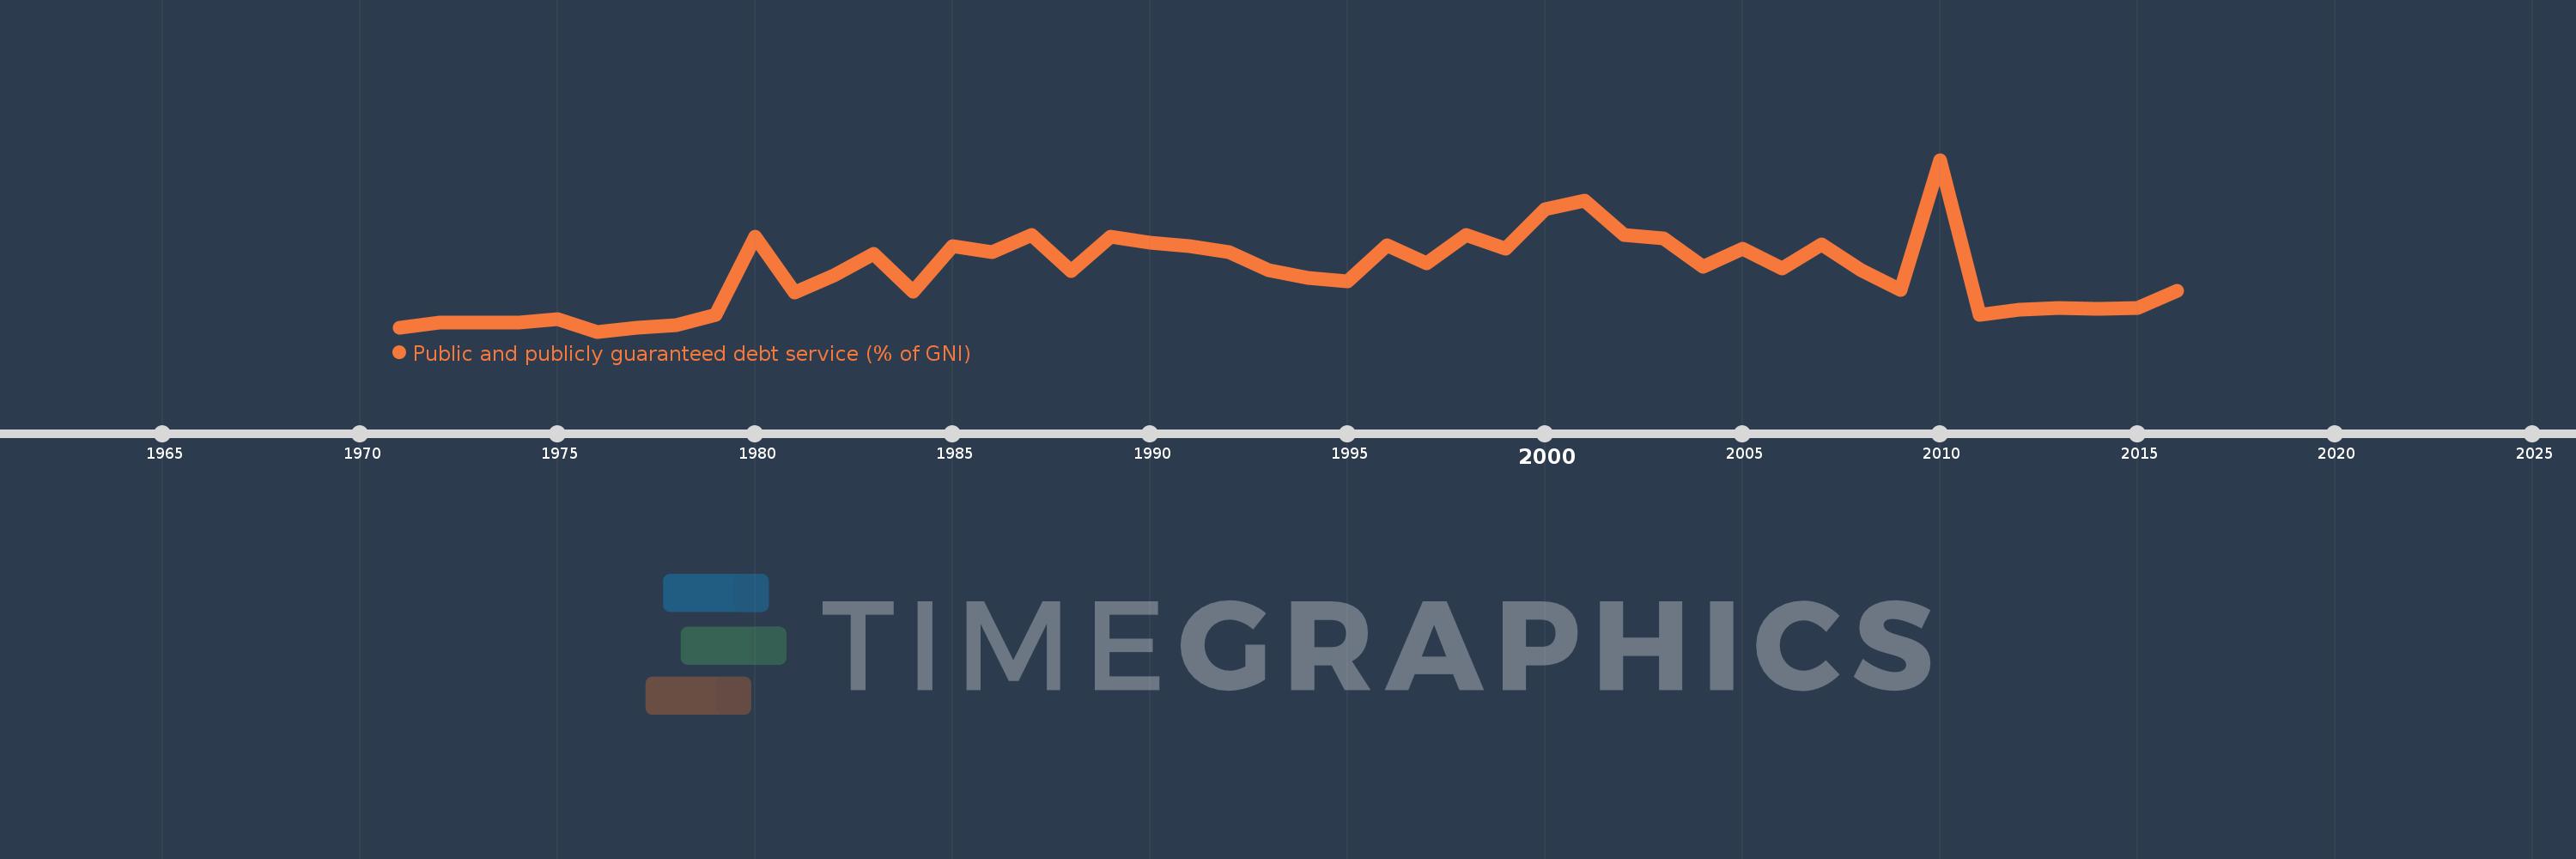
Public and publicly guaranteed debt service (% of GNI)
2016,2015,2014,2013,2012,2011,2010,2009,2008,2007,2006,2005,2004,2003,2002,2001,2000,1999,1998,1997,1996,1995,1994,1993,1992,1991,1990,1989,1988,1987,1986,1985,1984,1983,1982,1981,1980,1979,1978,1977,1976,1975,1974,1973,1972,1971
Estas estadísticas en otros países:
línea de tiempo (timeline):
En esta escala de tiempo se presenta un gráfico de 1971 y 2016 de Ecuador. Los datos de 1970 están ausentes. El número de observaciones reales por fecha: 46.
Fuente (nombre):
Indicadores del desarrollo mundial
Fuente (organización):
World Bank, International Debt Statistics.
Categorías:
External Debt
Se ha actualizado:
23 abr 2017 año
Los indicadores de los cambios de valor en los últimos años
Mínimo:
0.717
1 ene 1976 año
Máximo:
11.946
1 ene 2010 año
A la fecha de observación
Valor
Cambio absoluto
El cambio con respecto al valor anterior
1 ene 1971 año
0.943
+0.943
0.0%
1 ene 1972 año
1.322
+0.379
40.18%
1 ene 1973 año
1.3
-0.022
-1.65%
1 ene 1974 año
1.316
+0.017
1.28%
1 ene 1975 año
1.523
+0.207
15.69%
1 ene 1976 año
0.717
-0.806
-52.91%
1 ene 1977 año
0.97
+0.253
35.29%
1 ene 1978 año
1.139
+0.169
17.39%
1 ene 1979 año
1.83
+0.691
60.66%
1 ene 1980 año
6.902
+5.072
277.18%
1 ene 1981 año
3.25
-3.652
-52.91%
1 ene 1982 año
4.385
+1.134
34.9%
1 ene 1983 año
5.823
+1.438
32.8%
1 ene 1984 año
3.314
-2.509
-43.09%
1 ene 1985 año
6.328
+3.014
90.95%
1 ene 1986 año
5.931
-0.396
-6.26%
1 ene 1987 año
7.013
+1.081
18.23%
1 ene 1988 año
4.679
-2.334
-33.28%
1 ene 1989 año
6.907
+2.229
47.64%
1 ene 1990 año
6.515
-0.392
-5.68%
1 ene 1991 año
6.285
-0.231
-3.54%
1 ene 1992 año
5.885
-0.4
-6.37%
1 ene 1993 año
4.752
-1.132
-19.24%
1 ene 1994 año
4.207
-0.545
-11.47%
1 ene 1995 año
3.983
-0.224
-5.33%
1 ene 1996 año
6.373
+2.391
60.02%
1 ene 1997 año
5.183
-1.19
-18.67%
1 ene 1998 año
7.056
+1.873
36.13%
1 ene 1999 año
6.136
-0.92
-13.03%
1 ene 2000 año
8.73
+2.594
42.27%
1 ene 2001 año
9.299
+0.569
6.52%
1 ene 2002 año
7.032
-2.266
-24.37%
1 ene 2003 año
6.826
-0.207
-2.94%
1 ene 2004 año
4.97
-1.856
-27.19%
1 ene 2005 año
6.136
+1.166
23.47%
1 ene 2006 año
4.85
-1.286
-20.96%
1 ene 2007 año
6.427
+1.577
32.52%
1 ene 2008 año
4.745
-1.683
-26.18%
1 ene 2009 año
3.43
-1.314
-27.7%
1 ene 2010 año
11.946
+8.515
248.23%
1 ene 2011 año
1.787
-10.159
-85.04%
1 ene 2012 año
2.152
+0.365
20.45%
1 ene 2013 año
2.234
+0.082
3.8%
1 ene 2014 año
2.229
-0.005
-0.22%
1 ene 2015 año
2.246
+0.017
0.75%
1 ene 2016 año
3.396
+1.151
51.23%
Ranking de los países por los datos estadísticos actuales


Comentarios: