29
/es/
es
AIzaSyAYiBZKx7MnpbEhh9jyipgxe19OcubqV5w
April 1, 2024
109051
Comoros
COM
true
2
1
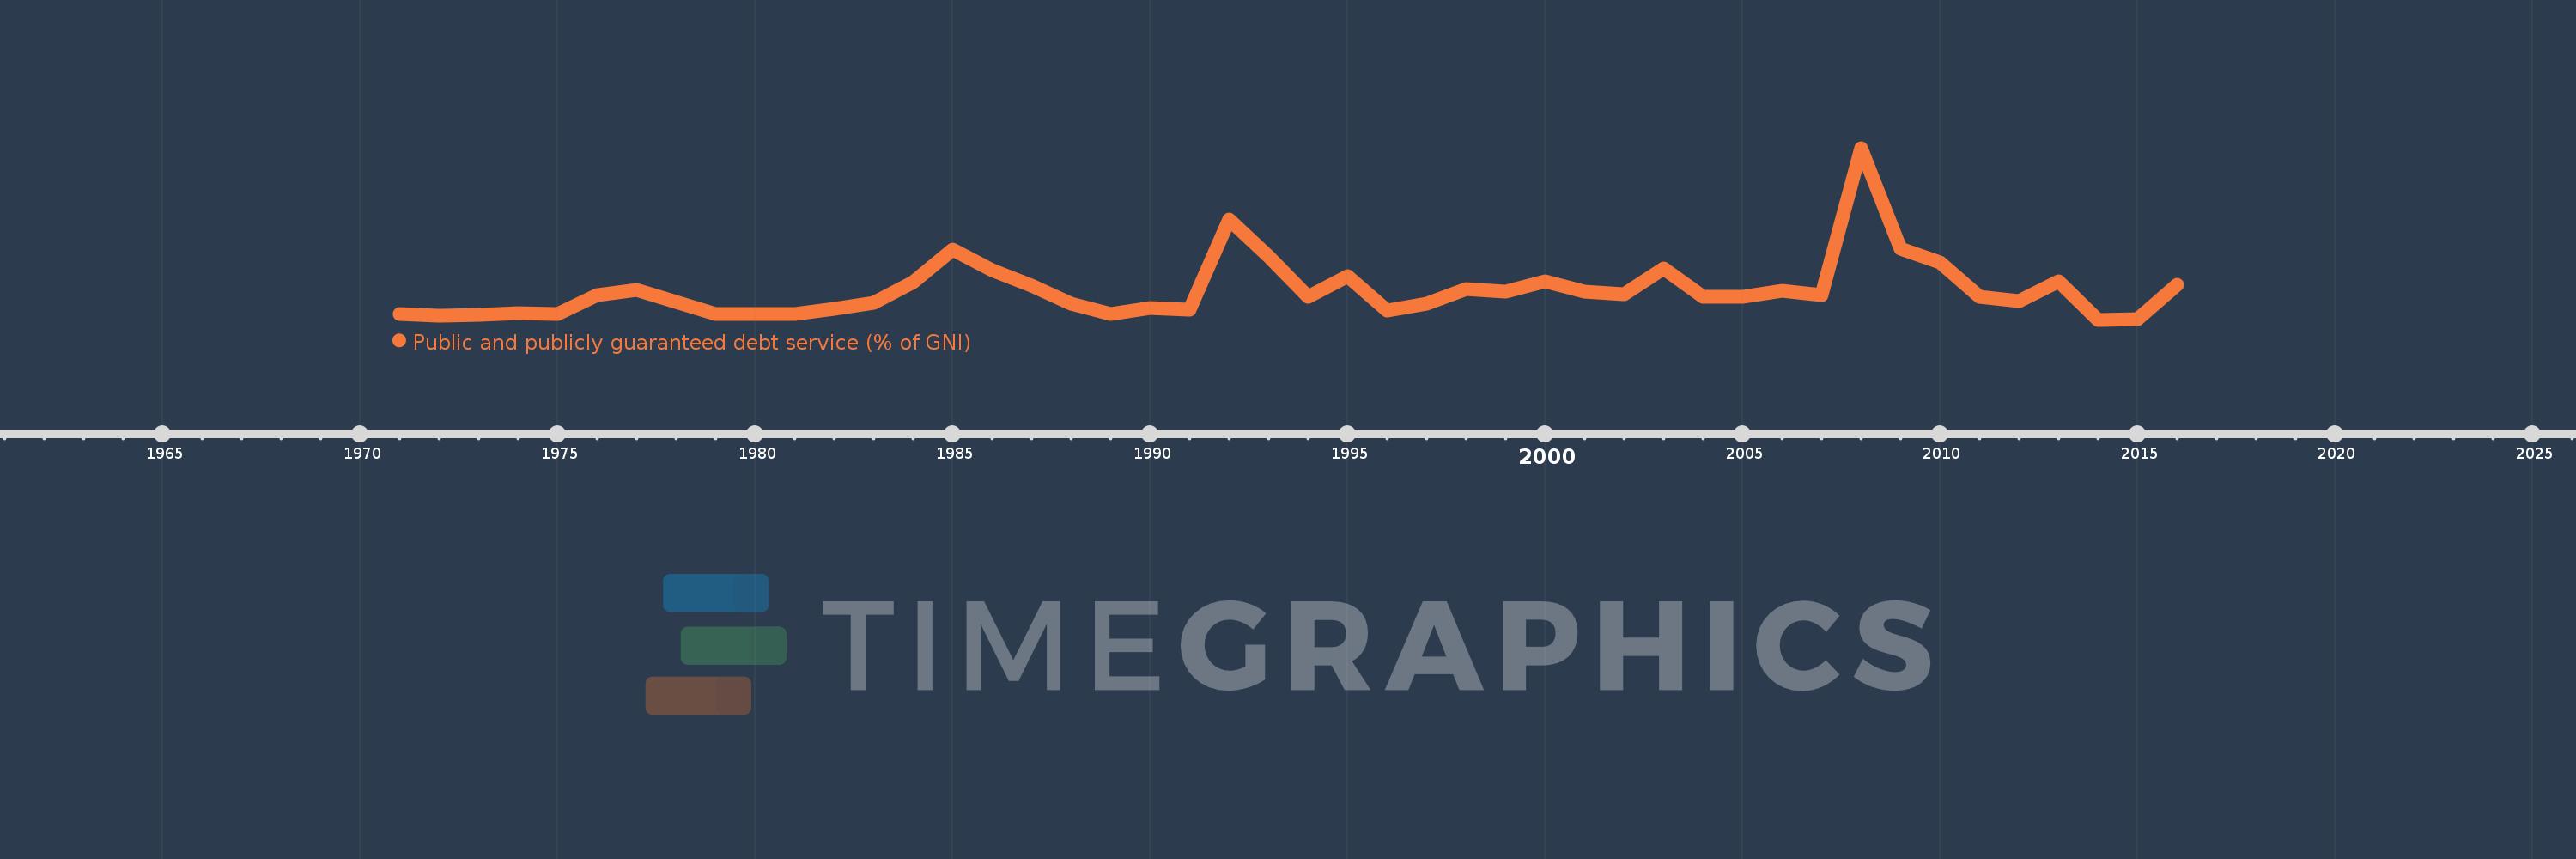
Public and publicly guaranteed debt service (% of GNI)
2016,2015,2014,2013,2012,2011,2010,2009,2008,2007,2006,2005,2004,2003,2002,2001,2000,1999,1998,1997,1996,1995,1994,1993,1992,1991,1990,1989,1988,1987,1986,1985,1984,1983,1982,1981,1980,1979,1978,1977,1976,1975,1974,1973,1972,1971
Estas estadísticas en otros países:
línea de tiempo (timeline):
En esta escala de tiempo se presenta un gráfico de 1971 y 2016 de Comoros. Los datos de 1970 están ausentes. El número de observaciones reales por fecha: 46.
Fuente (nombre):
Indicadores del desarrollo mundial
Fuente (organización):
World Bank, International Debt Statistics.
Categorías:
External Debt
Se ha actualizado:
23 abr 2017 año
Los indicadores de los cambios de valor en los últimos años
Mínimo:
0.073
1 ene 2014 año
Máximo:
5.593
1 ene 2008 año
A la fecha de observación
Valor
Cambio absoluto
El cambio con respecto al valor anterior
1 ene 1971 año
0.254
+0.254
0.0%
1 ene 1972 año
0.199
-0.055
-21.79%
1 ene 1973 año
0.221
+0.023
11.45%
1 ene 1974 año
0.283
+0.062
27.89%
1 ene 1975 año
0.262
-0.021
-7.29%
1 ene 1976 año
0.878
+0.615
234.33%
1 ene 1977 año
1.021
+0.143
16.31%
1 ene 1978 año
0.646
-0.375
-36.73%
1 ene 1979 año
0.253
-0.393
-60.81%
1 ene 1980 año
0.268
+0.015
6.04%
1 ene 1981 año
0.245
-0.024
-8.76%
1 ene 1982 año
0.433
+0.188
76.84%
1 ene 1983 año
0.63
+0.197
45.42%
1 ene 1984 año
1.268
+0.638
101.38%
1 ene 1985 año
2.331
+1.063
83.8%
1 ene 1986 año
1.659
-0.672
-28.83%
1 ene 1987 año
1.164
-0.495
-29.86%
1 ene 1988 año
0.578
-0.586
-50.36%
1 ene 1989 año
0.26
-0.318
-55.04%
1 ene 1990 año
0.464
+0.205
78.86%
1 ene 1991 año
0.385
-0.08
-17.19%
1 ene 1992 año
3.299
+2.914
757.6%
1 ene 1993 año
2.098
-1.201
-36.4%
1 ene 1994 año
0.797
-1.301
-62.02%
1 ene 1995 año
1.468
+0.671
84.23%
1 ene 1996 año
0.37
-1.098
-74.79%
1 ene 1997 año
0.588
+0.218
58.94%
1 ene 1998 año
1.045
+0.456
77.58%
1 ene 1999 año
0.963
-0.082
-7.84%
1 ene 2000 año
1.305
+0.343
35.59%
1 ene 2001 año
0.984
-0.321
-24.59%
1 ene 2002 año
0.892
-0.092
-9.37%
1 ene 2003 año
1.725
+0.833
93.34%
1 ene 2004 año
0.817
-0.908
-52.66%
1 ene 2005 año
0.823
+0.006
0.76%
1 ene 2006 año
1.016
+0.194
23.54%
1 ene 2007 año
0.866
-0.15
-14.81%
1 ene 2008 año
5.593
+4.727
545.91%
1 ene 2009 año
2.357
-3.236
-57.86%
1 ene 2010 año
1.926
-0.431
-18.28%
1 ene 2011 año
0.804
-1.122
-58.27%
1 ene 2012 año
0.671
-0.133
-16.57%
1 ene 2013 año
1.296
+0.626
93.32%
1 ene 2014 año
0.073
-1.224
-94.39%
1 ene 2015 año
0.09
+0.018
24.13%
1 ene 2016 año
1.185
+1.095
1.21 mil%
Ranking de los países por los datos estadísticos actuales


Comentarios: