29
/es/
es
AIzaSyAYiBZKx7MnpbEhh9jyipgxe19OcubqV5w
April 1, 2024
149710
Haiti
HTI
true
2
1
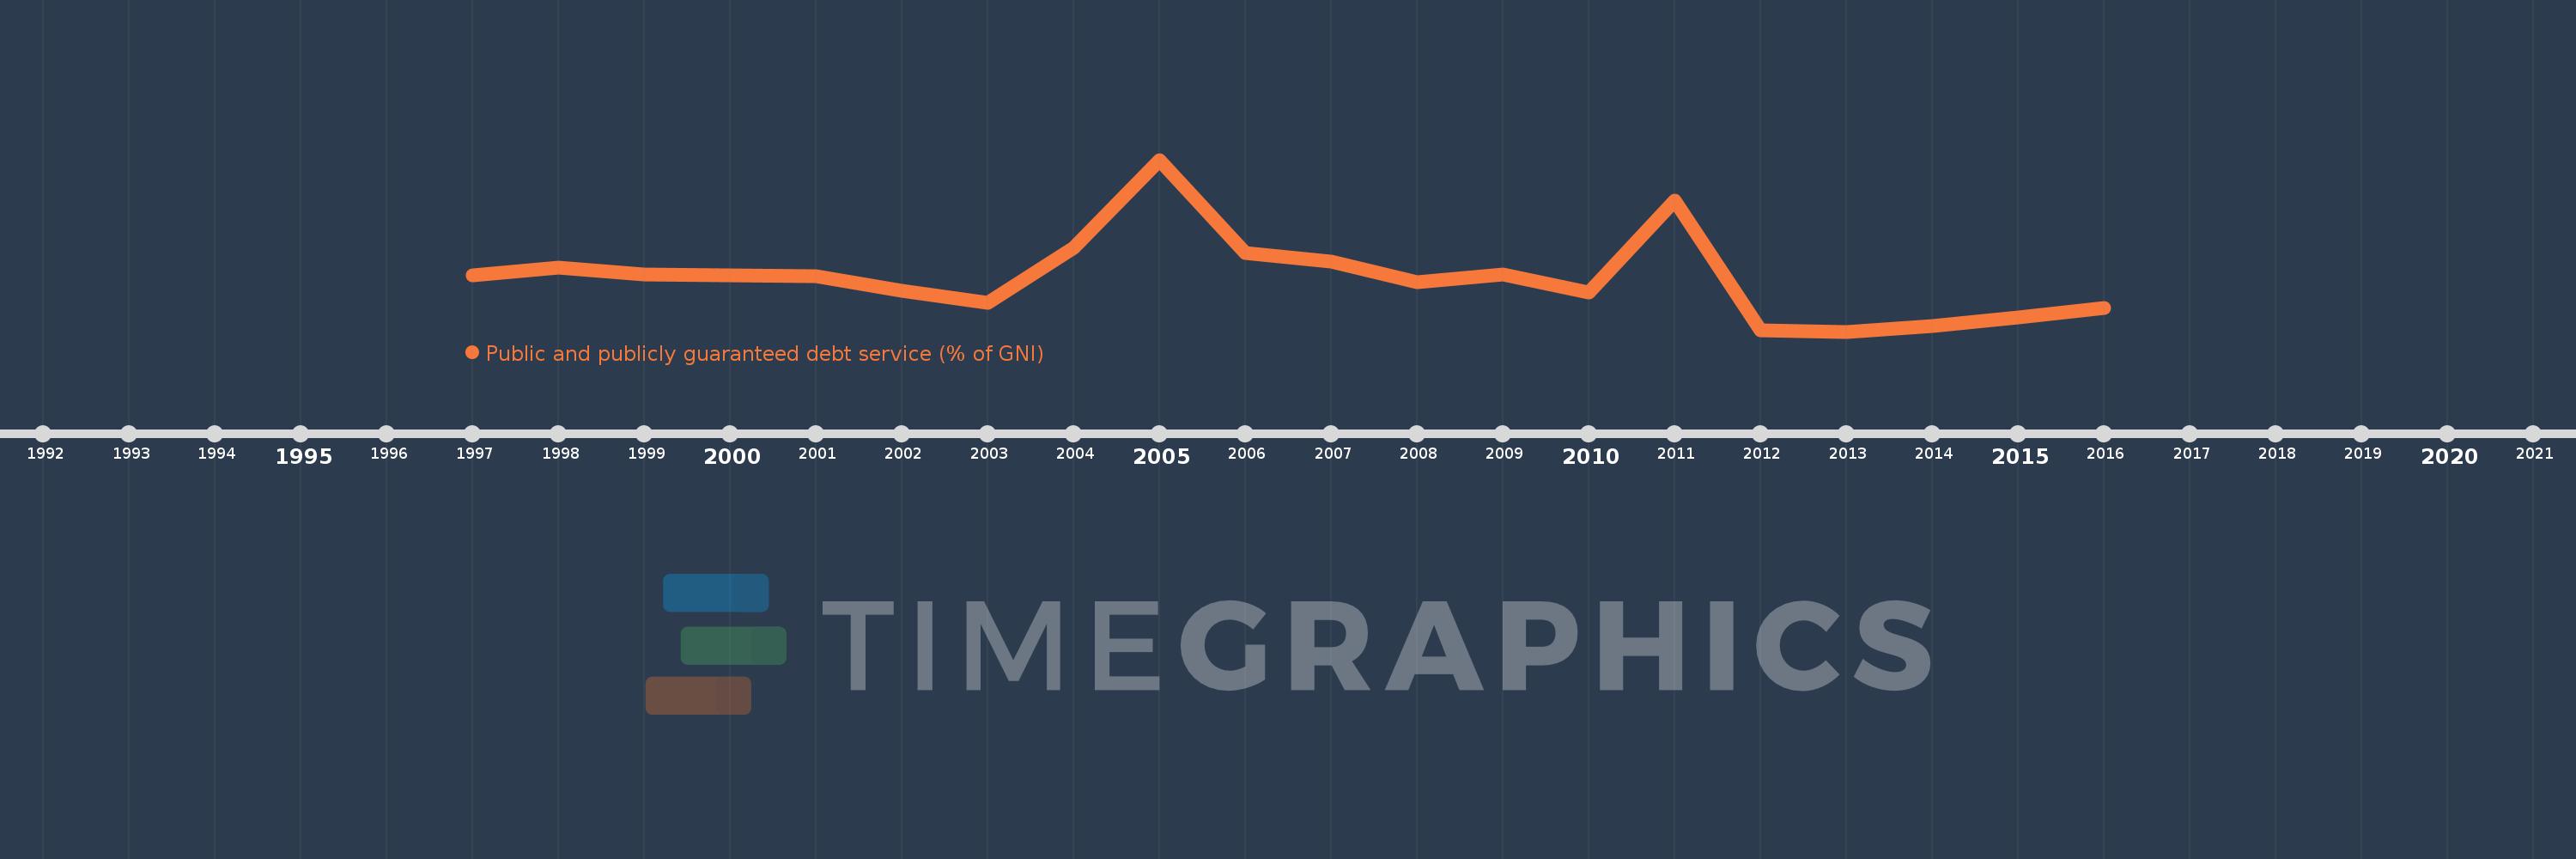
Public and publicly guaranteed debt service (% of GNI)
2016,2015,2014,2013,2012,2011,2010,2009,2008,2007,2006,2005,2004,2003,2002,2001,2000,1999,1998,1997
Estas estadísticas en otros países:
línea de tiempo (timeline):
En esta escala de tiempo se presenta un gráfico de 1997 y 2016 de Haiti. Los datos de 1996 están ausentes. El número de observaciones reales por fecha: 20.
Fuente (nombre):
Indicadores del desarrollo mundial
Fuente (organización):
World Bank, International Debt Statistics.
Categorías:
External Debt
Se ha actualizado:
23 abr 2017 año
Los indicadores de los cambios de valor en los últimos años
Mínimo:
0.046
1 ene 2013 año
Máximo:
2.559
1 ene 2005 año
A la fecha de observación
Valor
Cambio absoluto
El cambio con respecto al valor anterior
1 ene 1997 año
0.863
+0.863
0.0%
1 ene 1998 año
0.987
+0.124
14.35%
1 ene 1999 año
0.876
-0.111
-11.23%
1 ene 2000 año
0.863
-0.013
-1.5%
1 ene 2001 año
0.86
-0.003
-0.3%
1 ene 2002 año
0.637
-0.223
-25.89%
1 ene 2003 año
0.472
-0.165
-25.94%
1 ene 2004 año
1.269
+0.797
168.84%
1 ene 2005 año
2.559
+1.29
101.61%
1 ene 2006 año
1.192
-1.367
-53.43%
1 ene 2007 año
1.067
-0.125
-10.45%
1 ene 2008 año
0.774
-0.294
-27.52%
1 ene 2009 año
0.878
+0.104
13.49%
1 ene 2010 año
0.622
-0.256
-29.16%
1 ene 2011 año
1.964
+1.342
215.75%
1 ene 2012 año
0.067
-1.897
-96.59%
1 ene 2013 año
0.046
-0.021
-32.08%
1 ene 2014 año
0.123
+0.078
170.45%
1 ene 2015 año
0.258
+0.135
109.36%
1 ene 2016 año
0.389
+0.132
51.07%
Ranking de los países por los datos estadísticos actuales


Comentarios: