29
/es/
es
AIzaSyAYiBZKx7MnpbEhh9jyipgxe19OcubqV5w
April 1, 2024
26853
Early-demographic dividend
EAR
false
2
1
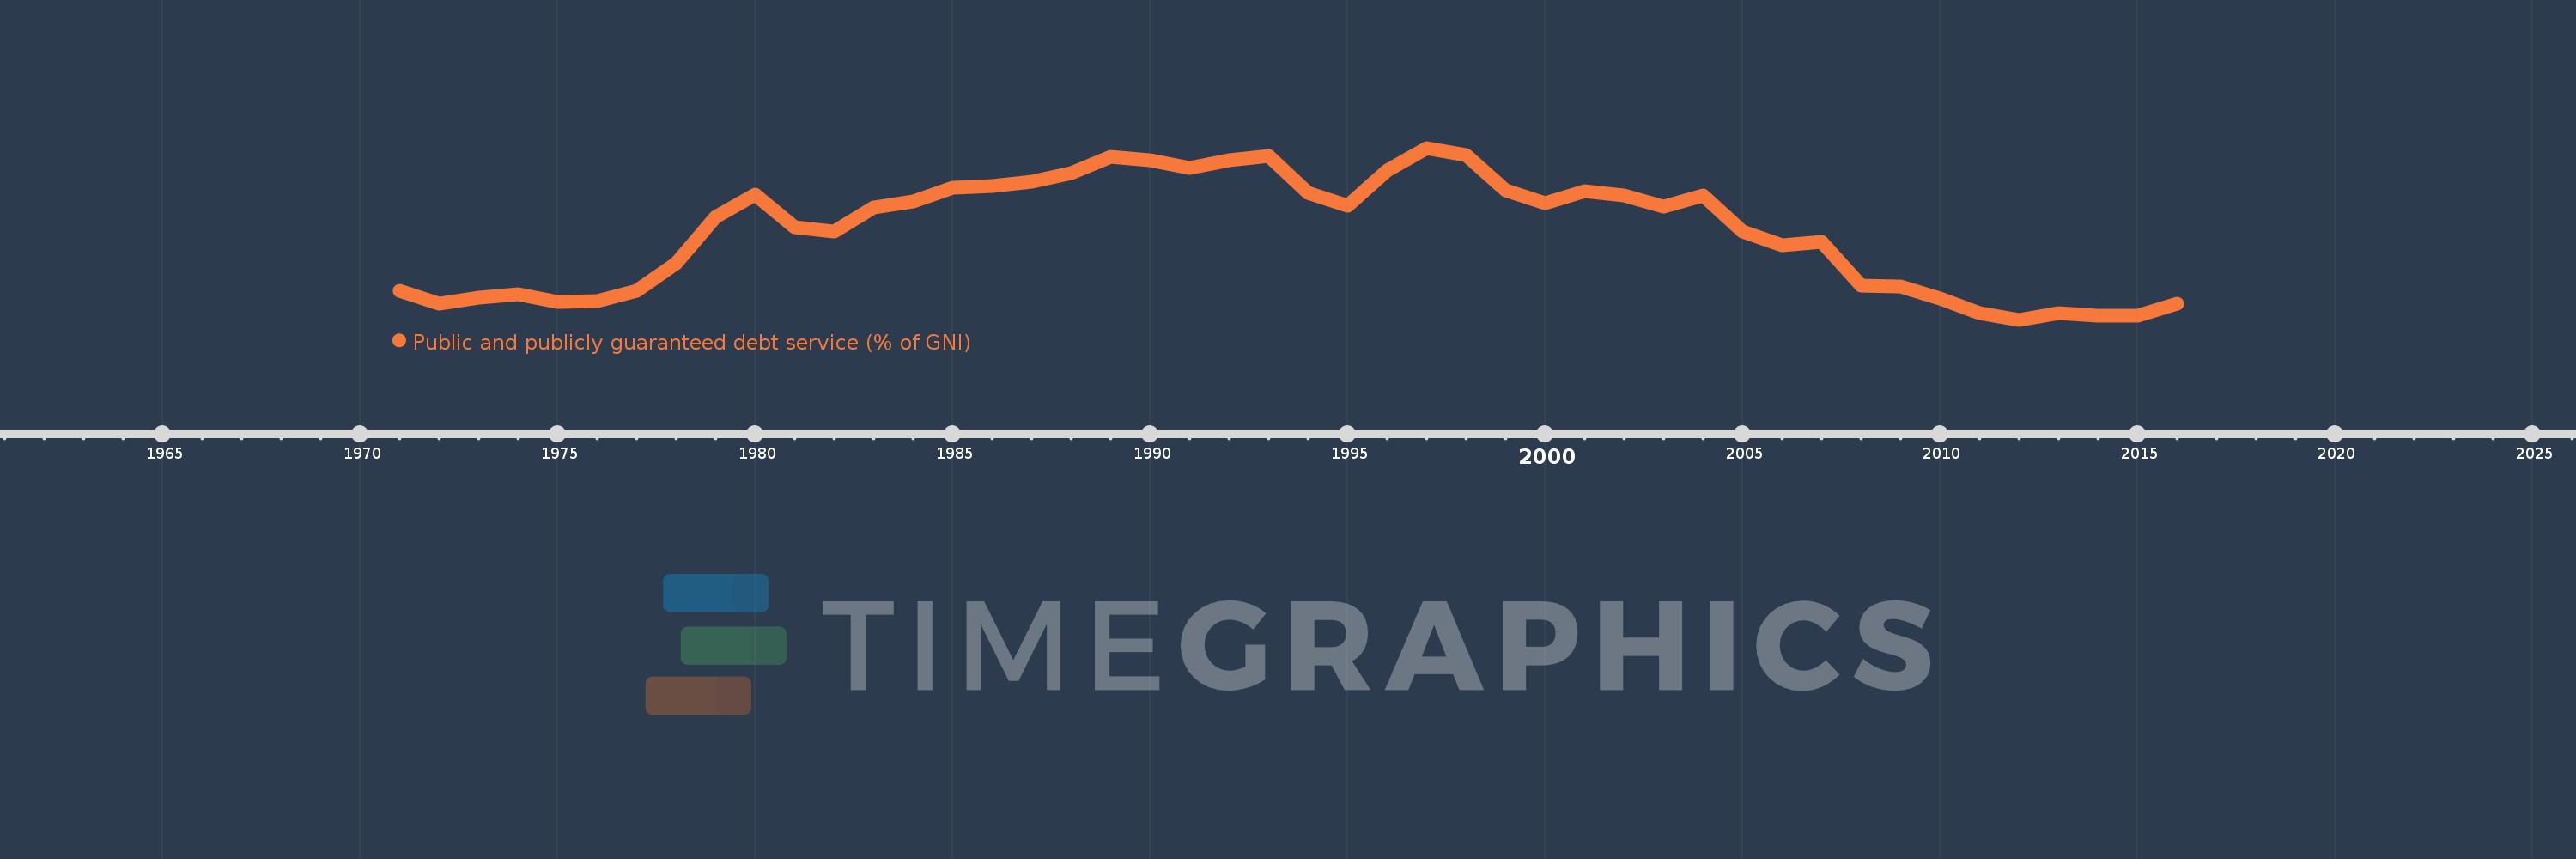
Public and publicly guaranteed debt service (% of GNI)
2016,2015,2014,2013,2012,2011,2010,2009,2008,2007,2006,2005,2004,2003,2002,2001,2000,1999,1998,1997,1996,1995,1994,1993,1992,1991,1990,1989,1988,1987,1986,1985,1984,1983,1982,1981,1980,1979,1978,1977,1976,1975,1974,1973,1972,1971
Estas estadísticas en otros países:
línea de tiempo (timeline):
En esta escala de tiempo se presenta un gráfico de 1971 y 2016 de Early-demographic dividend. Los datos de 1970 están ausentes. El número de observaciones reales por fecha: 46.
Fuente (nombre):
Indicadores del desarrollo mundial
Fuente (organización):
World Bank, International Debt Statistics.
Categorías:
External Debt
Se ha actualizado:
23 abr 2017 año
Los indicadores de los cambios de valor en los últimos años
Mínimo:
1.131
1 ene 2012 año
Máximo:
4.216
1 ene 1997 año
A la fecha de observación
Valor
Cambio absoluto
El cambio con respecto al valor anterior
1 ene 1971 año
1.655
+1.655
0.0%
1 ene 1972 año
1.417
-0.238
-14.41%
1 ene 1973 año
1.531
+0.115
8.08%
1 ene 1974 año
1.587
+0.056
3.65%
1 ene 1975 año
1.447
-0.14
-8.82%
1 ene 1976 año
1.461
+0.014
0.96%
1 ene 1977 año
1.648
+0.187
12.78%
1 ene 1978 año
2.138
+0.49
29.77%
1 ene 1979 año
2.971
+0.833
38.95%
1 ene 1980 año
3.382
+0.411
13.83%
1 ene 1981 año
2.795
-0.587
-17.36%
1 ene 1982 año
2.719
-0.076
-2.72%
1 ene 1983 año
3.147
+0.428
15.74%
1 ene 1984 año
3.259
+0.113
3.58%
1 ene 1985 año
3.495
+0.236
7.24%
1 ene 1986 año
3.525
+0.03
0.86%
1 ene 1987 año
3.609
+0.084
2.37%
1 ene 1988 año
3.761
+0.152
4.2%
1 ene 1989 año
4.051
+0.291
7.73%
1 ene 1990 año
3.99
-0.061
-1.5%
1 ene 1991 año
3.849
-0.141
-3.54%
1 ene 1992 año
4.001
+0.152
3.94%
1 ene 1993 año
4.068
+0.067
1.67%
1 ene 1994 año
3.402
-0.665
-16.36%
1 ene 1995 año
3.172
-0.23
-6.77%
1 ene 1996 año
3.803
+0.631
19.91%
1 ene 1997 año
4.216
+0.413
10.86%
1 ene 1998 año
4.094
-0.122
-2.9%
1 ene 1999 año
3.463
-0.631
-15.42%
1 ene 2000 año
3.23
-0.233
-6.72%
1 ene 2001 año
3.436
+0.206
6.39%
1 ene 2002 año
3.366
-0.07
-2.04%
1 ene 2003 año
3.156
-0.211
-6.25%
1 ene 2004 año
3.358
+0.202
6.41%
1 ene 2005 año
2.719
-0.64
-19.05%
1 ene 2006 año
2.469
-0.25
-9.19%
1 ene 2007 año
2.534
+0.065
2.64%
1 ene 2008 año
1.743
-0.791
-31.22%
1 ene 2009 año
1.724
-0.019
-1.07%
1 ene 2010 año
1.511
-0.213
-12.37%
1 ene 2011 año
1.246
-0.265
-17.54%
1 ene 2012 año
1.131
-0.115
-9.2%
1 ene 2013 año
1.247
+0.116
10.26%
1 ene 2014 año
1.201
-0.046
-3.72%
1 ene 2015 año
1.202
+0.002
0.13%
1 ene 2016 año
1.42
+0.218
18.1%
Ranking de los países por los datos estadísticos actuales


Comentarios: