29
/es/
es
AIzaSyAYiBZKx7MnpbEhh9jyipgxe19OcubqV5w
April 1, 2024
286528
Zambia
ZMB
true
2
1
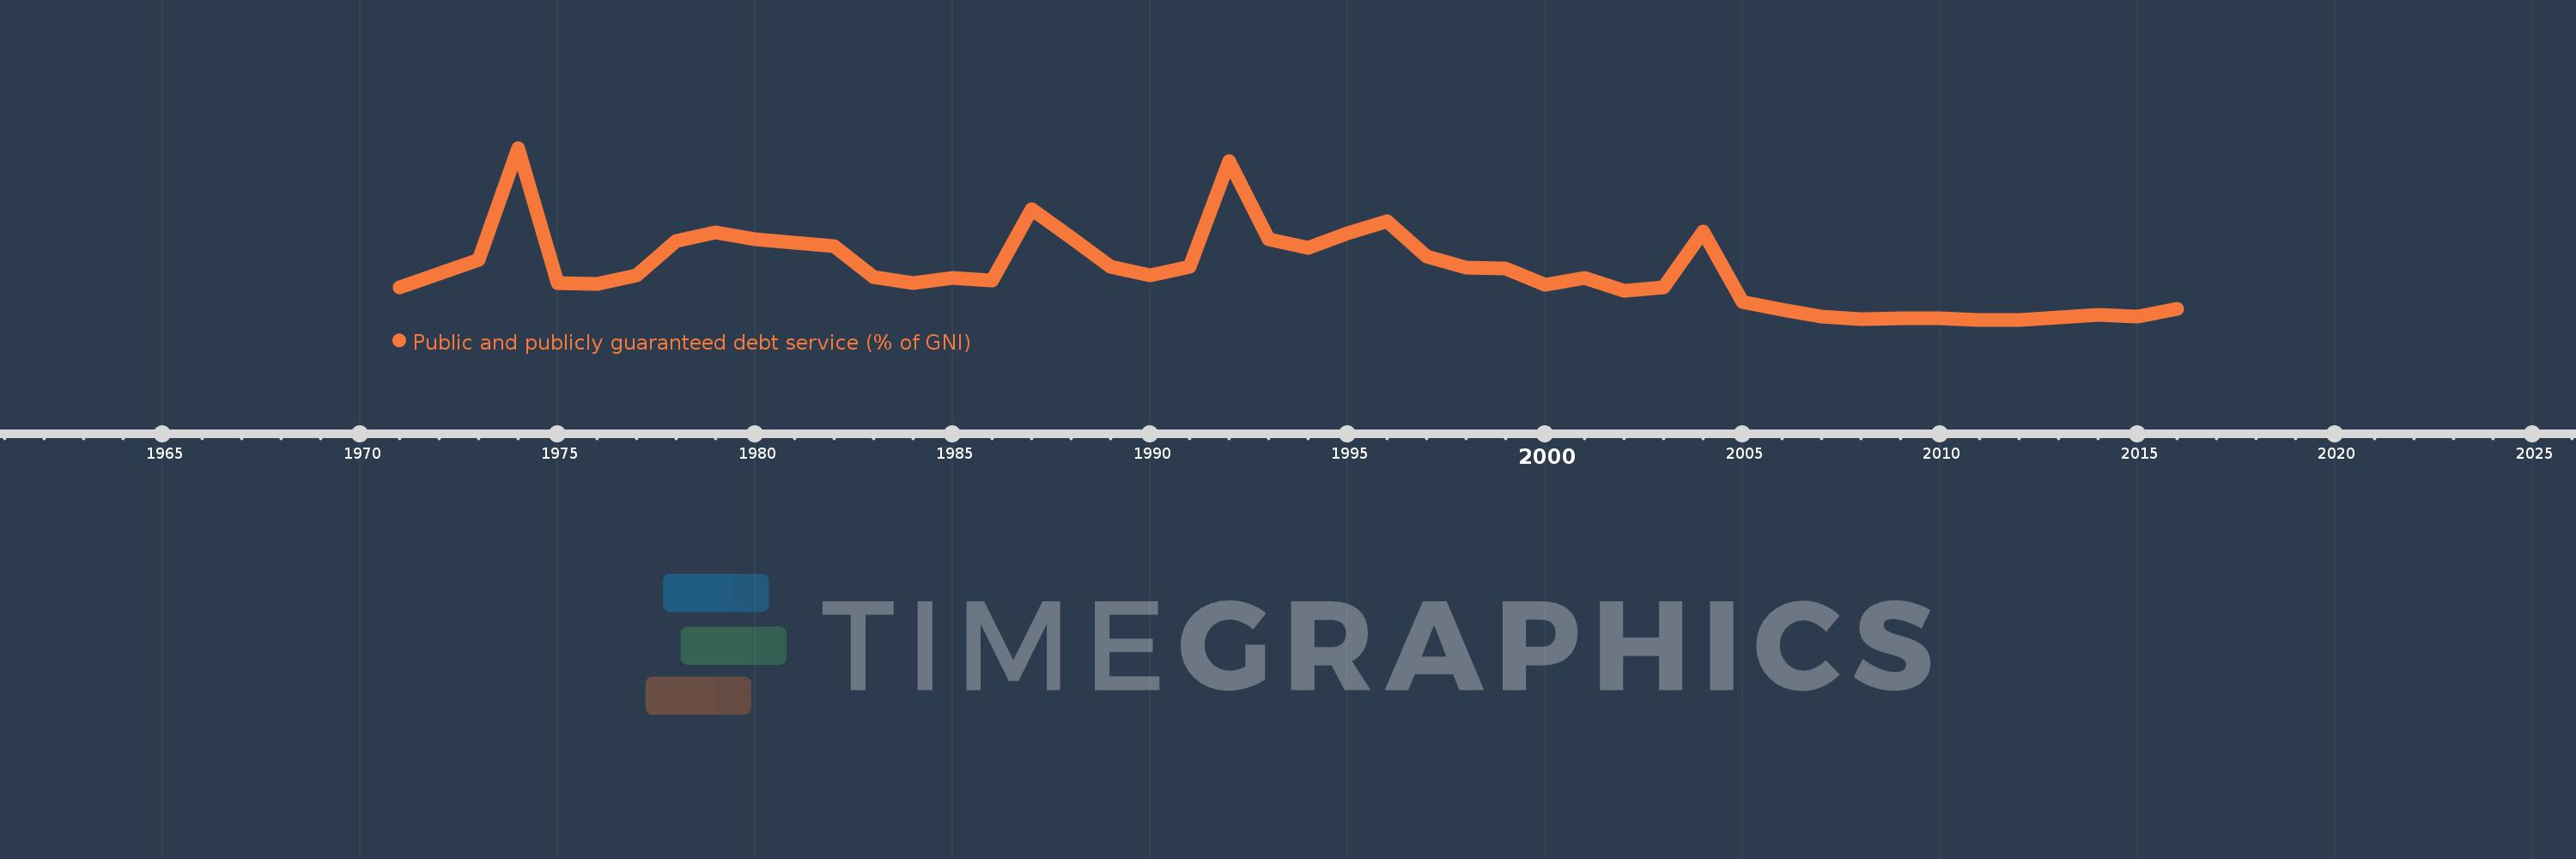
Public and publicly guaranteed debt service (% of GNI)
2016,2015,2014,2013,2012,2011,2010,2009,2008,2007,2006,2005,2004,2003,2002,2001,2000,1999,1998,1997,1996,1995,1994,1993,1992,1991,1990,1989,1988,1987,1986,1985,1984,1983,1982,1981,1980,1979,1978,1977,1976,1975,1974,1973,1972,1971
Estas estadísticas en otros países:
línea de tiempo (timeline):
En esta escala de tiempo se presenta un gráfico de 1971 y 2016 de Zambia. Los datos de 1970 están ausentes. El número de observaciones reales por fecha: 46.
Fuente (nombre):
Indicadores del desarrollo mundial
Fuente (organización):
World Bank, International Debt Statistics.
Categorías:
External Debt
Se ha actualizado:
23 abr 2017 año
Los indicadores de los cambios de valor en los últimos años
Mínimo:
0.306
1 ene 2011 año
Máximo:
17.712
1 ene 1974 año
A la fecha de observación
Valor
Cambio absoluto
El cambio con respecto al valor anterior
1 ene 1971 año
3.6
+3.6
0.0%
1 ene 1972 año
4.968
+1.368
37.99%
1 ene 1973 año
6.344
+1.376
27.7%
1 ene 1974 año
17.712
+11.367
179.17%
1 ene 1975 año
3.979
-13.732
-77.53%
1 ene 1976 año
3.943
-0.036
-0.92%
1 ene 1977 año
4.845
+0.902
22.88%
1 ene 1978 año
8.298
+3.453
71.26%
1 ene 1979 año
9.128
+0.831
10.01%
1 ene 1980 año
8.434
-0.694
-7.61%
1 ene 1981 año
8.117
-0.317
-3.76%
1 ene 1982 año
7.773
-0.344
-4.24%
1 ene 1983 año
4.623
-3.149
-40.52%
1 ene 1984 año
4.012
-0.612
-13.23%
1 ene 1985 año
4.574
+0.563
14.03%
1 ene 1986 año
4.304
-0.27
-5.91%
1 ene 1987 año
11.505
+7.201
167.32%
1 ene 1988 año
8.652
-2.853
-24.8%
1 ene 1989 año
5.7
-2.952
-34.12%
1 ene 1990 año
4.785
-0.915
-16.06%
1 ene 1991 año
5.694
+0.909
18.99%
1 ene 1992 año
16.376
+10.683
187.63%
1 ene 1993 año
8.464
-7.912
-48.32%
1 ene 1994 año
7.596
-0.868
-10.25%
1 ene 1995 año
9.039
+1.443
19.0%
1 ene 1996 año
10.263
+1.224
13.54%
1 ene 1997 año
6.761
-3.502
-34.12%
1 ene 1998 año
5.588
-1.173
-17.35%
1 ene 1999 año
5.516
-0.072
-1.28%
1 ene 2000 año
3.87
-1.646
-29.84%
1 ene 2001 año
4.512
+0.641
16.57%
1 ene 2002 año
3.203
-1.308
-29.0%
1 ene 2003 año
3.572
+0.368
11.5%
1 ene 2004 año
9.224
+5.652
158.25%
1 ene 2005 año
2.087
-7.138
-77.38%
1 ene 2006 año
1.297
-0.789
-37.82%
1 ene 2007 año
0.618
-0.679
-52.35%
1 ene 2008 año
0.331
-0.287
-46.47%
1 ene 2009 año
0.456
+0.125
37.74%
1 ene 2010 año
0.481
+0.025
5.47%
1 ene 2011 año
0.306
-0.174
-36.26%
1 ene 2012 año
0.308
+0.001
0.45%
1 ene 2013 año
0.556
+0.248
80.67%
1 ene 2014 año
0.834
+0.278
49.91%
1 ene 2015 año
0.633
-0.2
-24.02%
1 ene 2016 año
1.418
+0.784
123.79%
Ranking de los países por los datos estadísticos actuales


Comentarios: