29
/es/
es
AIzaSyAYiBZKx7MnpbEhh9jyipgxe19OcubqV5w
April 1, 2024
70664
Argentina
ARG
true
2
1
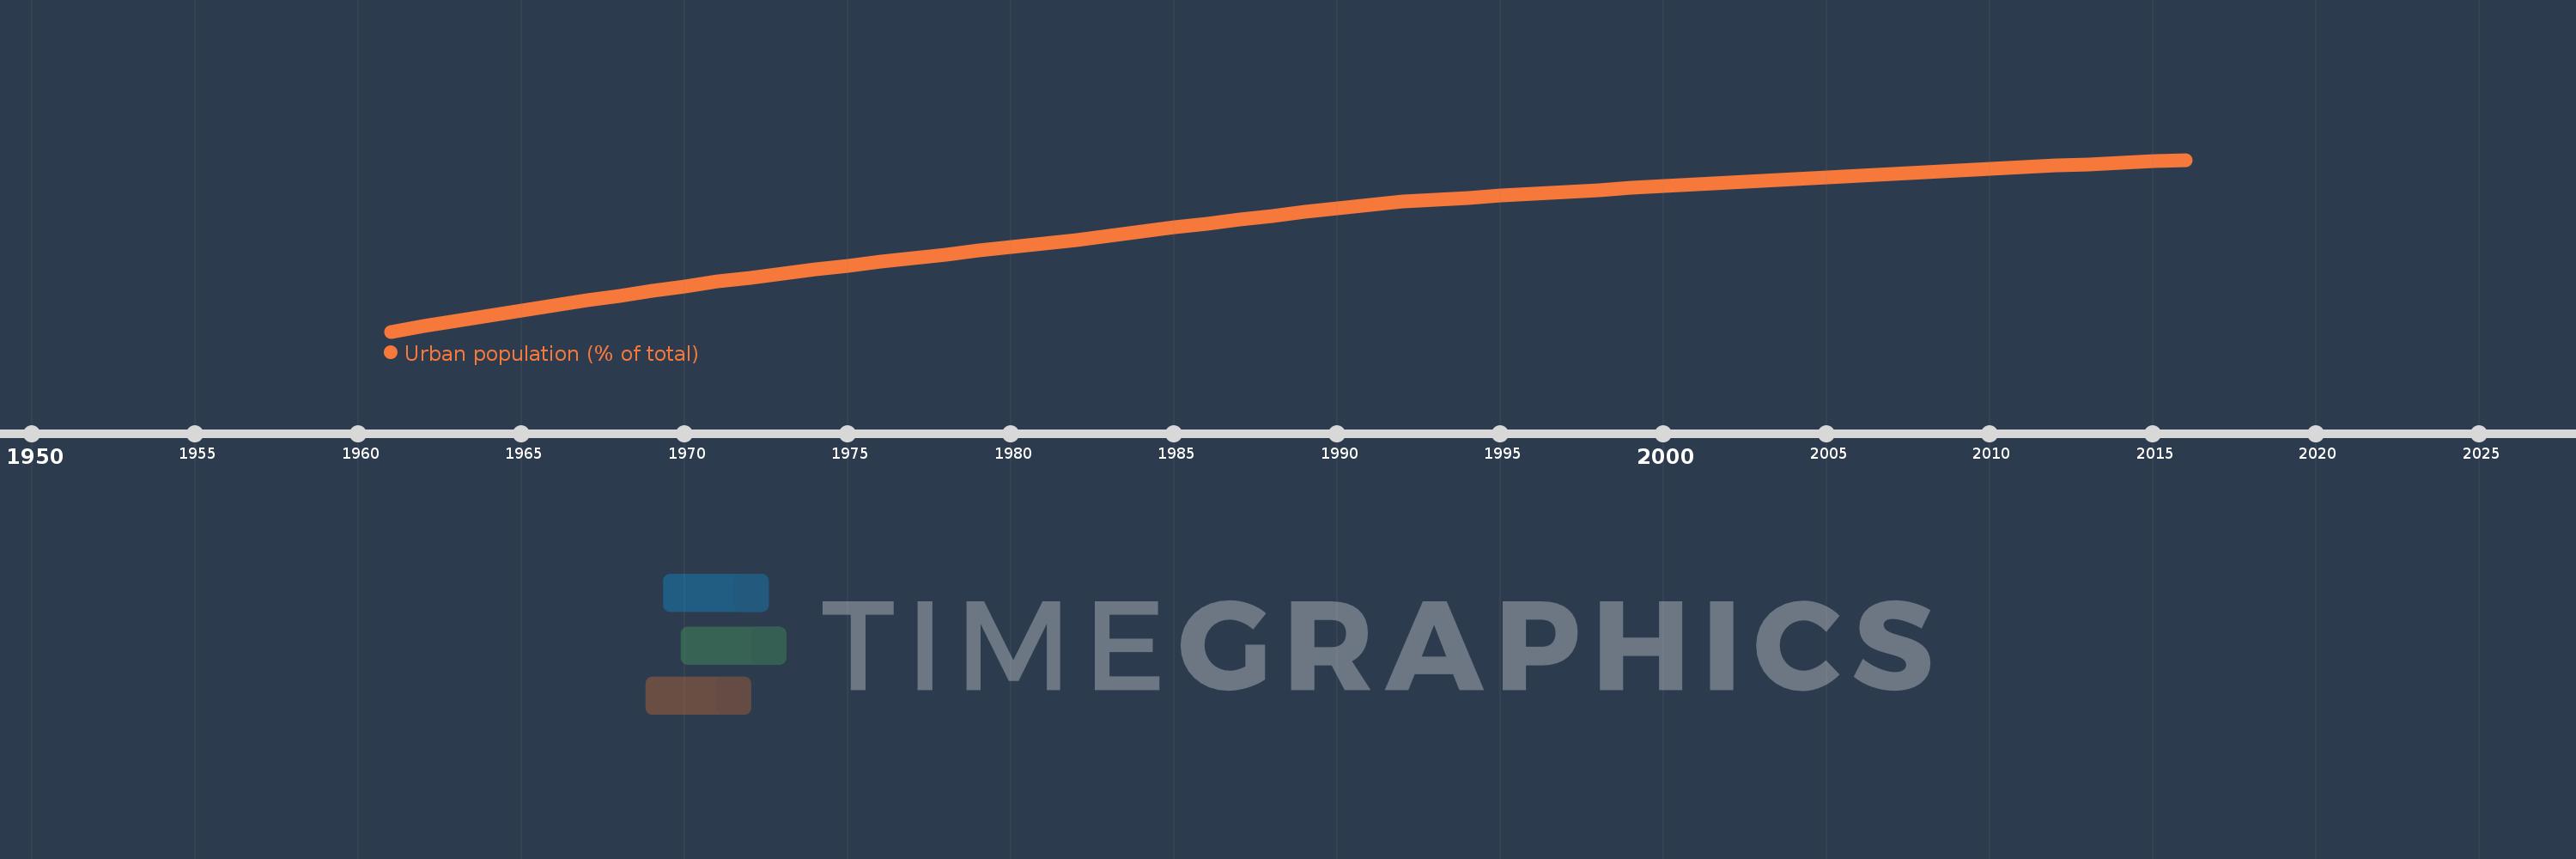
Urban population (% of total)
2016,2015,2014,2013,2012,2011,2010,2009,2008,2007,2006,2005,2004,2003,2002,2001,2000,1999,1998,1997,1996,1995,1994,1993,1992,1991,1990,1989,1988,1987,1986,1985,1984,1983,1982,1981,1980,1979,1978,1977,1976,1975,1974,1973,1972,1971,1970,1969,1968,1967,1966,1965,1964,1963,1962,1961
Estas estadísticas en otros países:
AfghanistanAlbaniaAlgeriaAmerican SamoaAndorraAngolaAntigua and BarbudaArab WorldArgentinaArmeniaArubaAustraliaAustriaAzerbaijanBahamas, TheBahrainBangladeshBarbadosBelarusBelgiumBelizeBeninBermudaBhutanBoliviaBosnia and HerzegovinaBotswanaBrazilBritish Virgin IslandsBrunei DarussalamBulgariaBurkina FasoBurundiCabo VerdeCambodiaCameroonCanadaCaribbean small statesCayman IslandsCentral African RepublicCentral Europe and the BalticsChadChannel IslandsChileChinaColombiaComorosCongo, Dem. Rep.Congo, Rep.Costa RicaCote d'IvoireCroatiaCubaCuracaoCyprusCzech RepublicDenmarkDjiboutiDominicaDominican RepublicEarly-demographic dividendEast Asia & PacificEast Asia & Pacific (excluding high income)East Asia & Pacific (IDA & IBRD countries)EcuadorEgypt, Arab Rep.El SalvadorEquatorial GuineaEritreaEstoniaEthiopiaEuro areaEurope & Central AsiaEurope & Central Asia (excluding high income)Europe & Central Asia (IDA & IBRD countries)European UnionFaroe IslandsFijiFinlandFragile and conflict affected situationsFranceFrench PolynesiaGabonGambia, TheGeorgiaGermanyGhanaGibraltarGreeceGreenlandGrenadaGuamGuatemalaGuineaGuinea-BissauGuyanaHaitiHeavily indebted poor countries (HIPC)High incomeHondurasHong Kong SAR, ChinaHungaryIBRD onlyIcelandIDA & IBRD totalIDA blendIDA onlyIDA totalIndiaIndonesiaIran, Islamic Rep.IraqIrelandIsle of ManIsraelItalyJamaicaJapanJordanKazakhstanKenyaKiribatiKorea, Dem. People’s Rep.Korea, Rep.KuwaitKyrgyz RepublicLao PDRLate-demographic dividendLatin America & Caribbean Latin America & Caribbean (excluding high income)Latin America & the Caribbean (IDA & IBRD countries)LatviaLeast developed countries: UN classificationLebanonLesothoLiberiaLibyaLiechtensteinLithuaniaLow & middle incomeLow incomeLower middle incomeLuxembourgMacao SAR, ChinaMacedonia, FYRMadagascarMalawiMalaysiaMaldivesMaliMaltaMarshall IslandsMauritaniaMauritiusMexicoMicronesia, Fed. Sts.Middle East & North AfricaMiddle East & North Africa (excluding high income)Middle East & North Africa (IDA & IBRD countries)Middle incomeMoldovaMonacoMongoliaMontenegroMoroccoMozambiqueMyanmarNamibiaNauruNepalNetherlandsNew CaledoniaNew ZealandNicaraguaNigerNigeriaNorth AmericaNorthern Mariana IslandsNorwayOECD membersOmanOther small statesPacific island small statesPakistanPalauPanamaPapua New GuineaParaguayPeruPhilippinesPolandPortugalPost-demographic dividendPre-demographic dividendPuerto RicoQatarRomaniaRussian FederationRwandaSamoaSan MarinoSao Tome and PrincipeSaudi ArabiaSenegalSerbiaSeychellesSierra LeoneSingaporeSint Maarten (Dutch part)Slovak RepublicSloveniaSmall statesSolomon IslandsSomaliaSouth AfricaSouth AsiaSouth Asia (IDA & IBRD)South SudanSpainSri LankaSt. Kitts and NevisSt. LuciaSt. Vincent and the GrenadinesSub-Saharan Africa Sub-Saharan Africa (excluding high income)Sub-Saharan Africa (IDA & IBRD countries)SudanSurinameSwazilandSwedenSwitzerlandSyrian Arab RepublicTajikistanTanzaniaThailandTimor-LesteTogoTongaTrinidad and TobagoTunisiaTurkeyTurkmenistanTurks and Caicos IslandsTuvaluUgandaUkraineUnited Arab EmiratesUnited KingdomUnited StatesUpper middle incomeUruguayUzbekistanVanuatuVenezuela, RBVietnamVirgin Islands (U.S.)West Bank and GazaWorldYemen, Rep.ZambiaZimbabwe línea de tiempo (timeline):
En esta escala de tiempo se presenta un gráfico de 1961 y 2016 de Argentina. Los datos de 1960 están ausentes. El número de observaciones reales por fecha: 56.
Fuente (nombre):
Indicadores del desarrollo mundial
Fuente (organización):
United Nations, World Urbanization Prospects.
Categorías:
Climate Change, Urban Development
Se ha actualizado:
23 abr 2017 año
Los indicadores de los cambios de valor en los últimos años
Mínimo:
73.611
1 ene 1961 año
Máximo:
91.751
1 ene 2016 año
A la fecha de observación
Valor
Cambio absoluto
El cambio con respecto al valor anterior
1 ene 1961 año
73.611
+73.611
0.0%
1 ene 1962 año
74.217
+0.606
0.82%
1 ene 1963 año
74.767
+0.55
0.74%
1 ene 1964 año
75.309
+0.542
0.72%
1 ene 1965 año
75.844
+0.535
0.71%
1 ene 1966 año
76.369
+0.525
0.69%
1 ene 1967 año
76.888
+0.519
0.68%
1 ene 1968 año
77.398
+0.51
0.66%
1 ene 1969 año
77.901
+0.503
0.65%
1 ene 1970 año
78.394
+0.493
0.63%
1 ene 1971 año
78.88
+0.486
0.62%
1 ene 1972 año
79.321
+0.441
0.56%
1 ene 1973 año
79.743
+0.422
0.53%
1 ene 1974 año
80.158
+0.415
0.52%
1 ene 1975 año
80.567
+0.409
0.51%
1 ene 1976 año
80.969
+0.402
0.5%
1 ene 1977 año
81.366
+0.397
0.49%
1 ene 1978 año
81.755
+0.389
0.48%
1 ene 1979 año
82.139
+0.384
0.47%
1 ene 1980 año
82.516
+0.377
0.46%
1 ene 1981 año
82.887
+0.371
0.45%
1 ene 1982 año
83.313
+0.426
0.51%
1 ene 1983 año
83.759
+0.446
0.54%
1 ene 1984 año
84.194
+0.435
0.52%
1 ene 1985 año
84.621
+0.427
0.51%
1 ene 1986 año
85.038
+0.417
0.49%
1 ene 1987 año
85.445
+0.407
0.48%
1 ene 1988 año
85.843
+0.398
0.47%
1 ene 1989 año
86.233
+0.39
0.45%
1 ene 1990 año
86.613
+0.38
0.44%
1 ene 1991 año
86.984
+0.371
0.43%
1 ene 1992 año
87.328
+0.344
0.4%
1 ene 1993 año
87.542
+0.214
0.25%
1 ene 1994 año
87.752
+0.21
0.24%
1 ene 1995 año
87.96
+0.208
0.24%
1 ene 1996 año
88.164
+0.204
0.23%
1 ene 1997 año
88.366
+0.202
0.23%
1 ene 1998 año
88.564
+0.198
0.22%
1 ene 1999 año
88.759
+0.195
0.22%
1 ene 2000 año
88.952
+0.193
0.22%
1 ene 2001 año
89.142
+0.19
0.21%
1 ene 2002 año
89.329
+0.187
0.21%
1 ene 2003 año
89.519
+0.19
0.21%
1 ene 2004 año
89.71
+0.191
0.21%
1 ene 2005 año
89.899
+0.189
0.21%
1 ene 2006 año
90.084
+0.185
0.21%
1 ene 2007 año
90.266
+0.182
0.2%
1 ene 2008 año
90.445
+0.179
0.2%
1 ene 2009 año
90.622
+0.177
0.2%
1 ene 2010 año
90.795
+0.173
0.19%
1 ene 2011 año
90.966
+0.171
0.19%
1 ene 2012 año
91.133
+0.167
0.18%
1 ene 2013 año
91.295
+0.162
0.18%
1 ene 2014 año
91.452
+0.157
0.17%
1 ene 2015 año
91.604
+0.152
0.17%
1 ene 2016 año
91.751
+0.147
0.16%
Ranking de los países por los datos estadísticos actuales


Comentarios: