29
/es/
es
AIzaSyAYiBZKx7MnpbEhh9jyipgxe19OcubqV5w
April 1, 2024
148727
Guyana
GUY
true
2
1
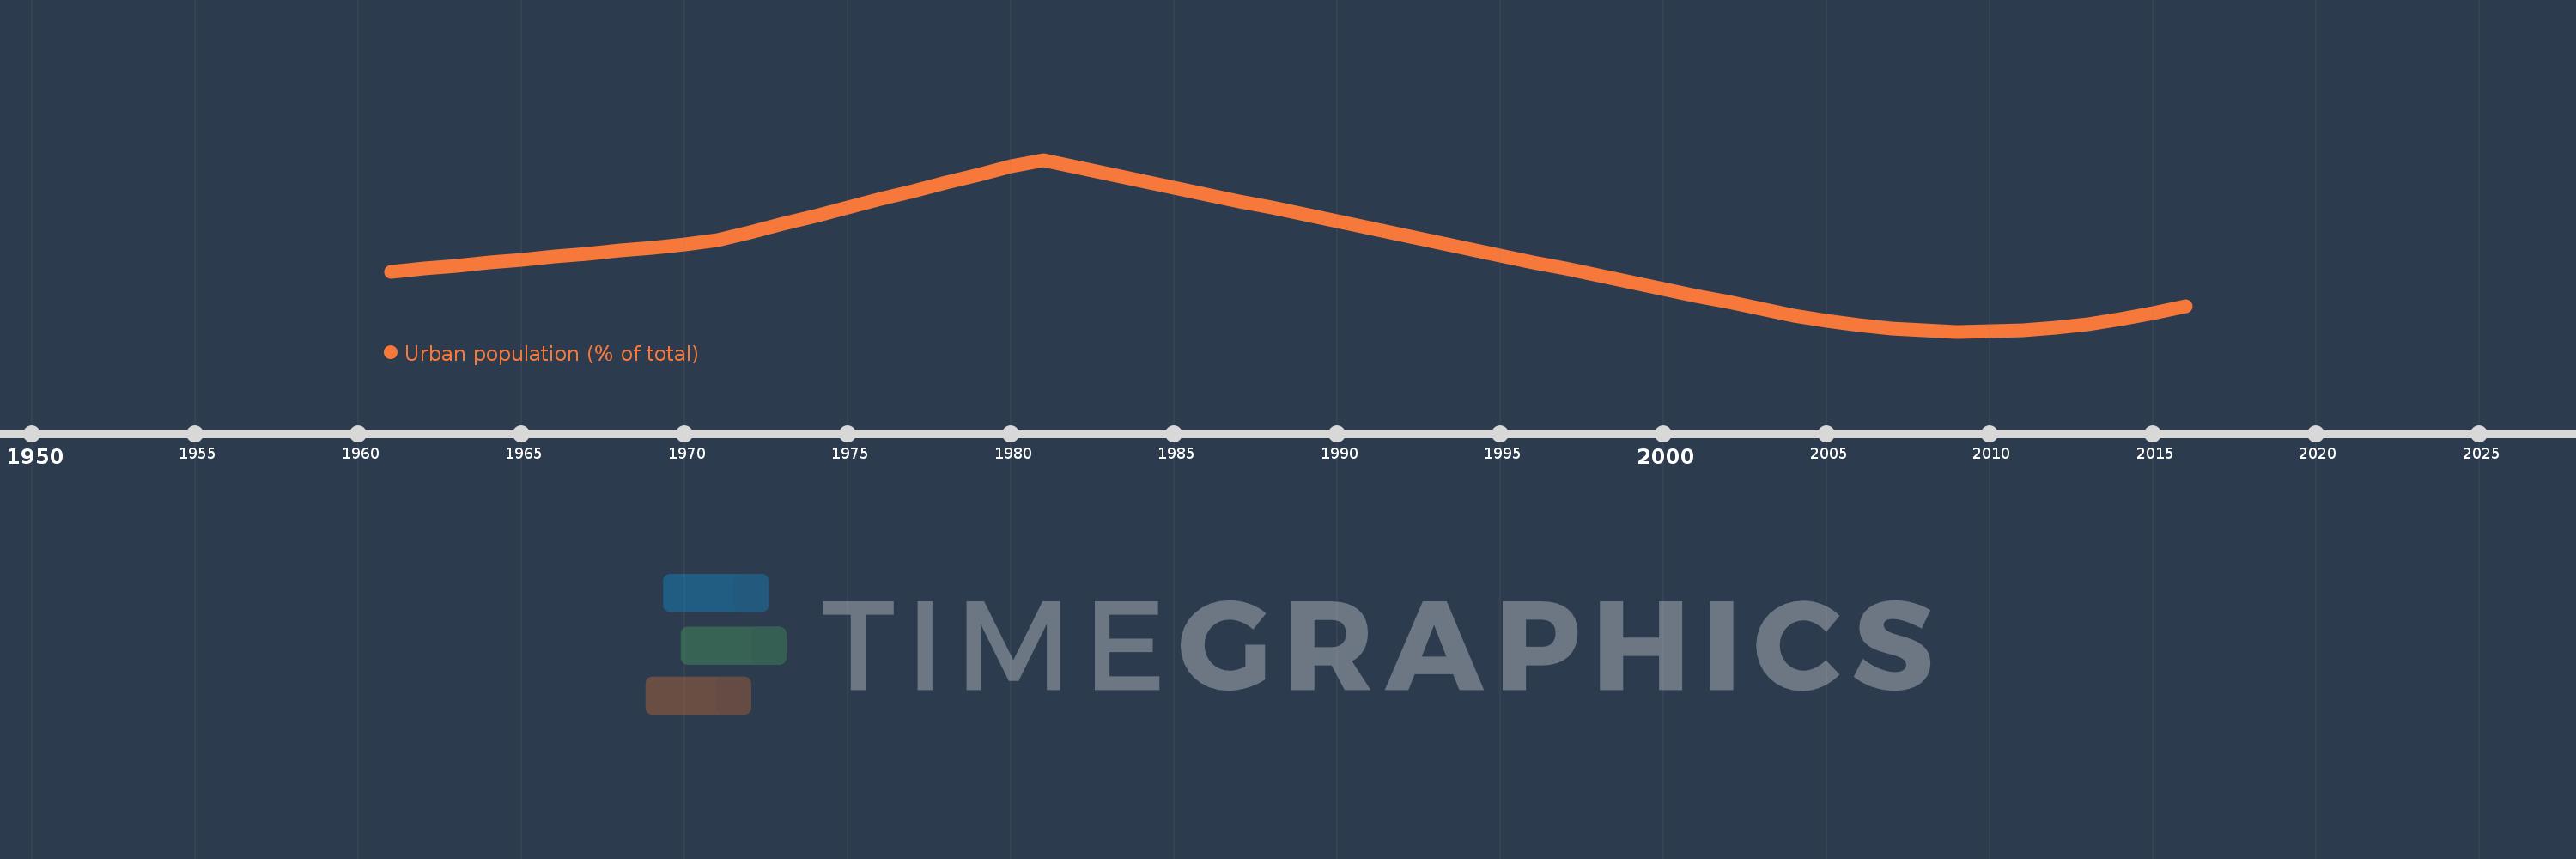
Urban population (% of total)
2016,2015,2014,2013,2012,2011,2010,2009,2008,2007,2006,2005,2004,2003,2002,2001,2000,1999,1998,1997,1996,1995,1994,1993,1992,1991,1990,1989,1988,1987,1986,1985,1984,1983,1982,1981,1980,1979,1978,1977,1976,1975,1974,1973,1972,1971,1970,1969,1968,1967,1966,1965,1964,1963,1962,1961
Estas estadísticas en otros países:
AfghanistanAlbaniaAlgeriaAmerican SamoaAndorraAngolaAntigua and BarbudaArab WorldArgentinaArmeniaArubaAustraliaAustriaAzerbaijanBahamas, TheBahrainBangladeshBarbadosBelarusBelgiumBelizeBeninBermudaBhutanBoliviaBosnia and HerzegovinaBotswanaBrazilBritish Virgin IslandsBrunei DarussalamBulgariaBurkina FasoBurundiCabo VerdeCambodiaCameroonCanadaCaribbean small statesCayman IslandsCentral African RepublicCentral Europe and the BalticsChadChannel IslandsChileChinaColombiaComorosCongo, Dem. Rep.Congo, Rep.Costa RicaCote d'IvoireCroatiaCubaCuracaoCyprusCzech RepublicDenmarkDjiboutiDominicaDominican RepublicEarly-demographic dividendEast Asia & PacificEast Asia & Pacific (excluding high income)East Asia & Pacific (IDA & IBRD countries)EcuadorEgypt, Arab Rep.El SalvadorEquatorial GuineaEritreaEstoniaEthiopiaEuro areaEurope & Central AsiaEurope & Central Asia (excluding high income)Europe & Central Asia (IDA & IBRD countries)European UnionFaroe IslandsFijiFinlandFragile and conflict affected situationsFranceFrench PolynesiaGabonGambia, TheGeorgiaGermanyGhanaGibraltarGreeceGreenlandGrenadaGuamGuatemalaGuineaGuinea-BissauGuyanaHaitiHeavily indebted poor countries (HIPC)High incomeHondurasHong Kong SAR, ChinaHungaryIBRD onlyIcelandIDA & IBRD totalIDA blendIDA onlyIDA totalIndiaIndonesiaIran, Islamic Rep.IraqIrelandIsle of ManIsraelItalyJamaicaJapanJordanKazakhstanKenyaKiribatiKorea, Dem. People’s Rep.Korea, Rep.KuwaitKyrgyz RepublicLao PDRLate-demographic dividendLatin America & Caribbean Latin America & Caribbean (excluding high income)Latin America & the Caribbean (IDA & IBRD countries)LatviaLeast developed countries: UN classificationLebanonLesothoLiberiaLibyaLiechtensteinLithuaniaLow & middle incomeLow incomeLower middle incomeLuxembourgMacao SAR, ChinaMacedonia, FYRMadagascarMalawiMalaysiaMaldivesMaliMaltaMarshall IslandsMauritaniaMauritiusMexicoMicronesia, Fed. Sts.Middle East & North AfricaMiddle East & North Africa (excluding high income)Middle East & North Africa (IDA & IBRD countries)Middle incomeMoldovaMonacoMongoliaMontenegroMoroccoMozambiqueMyanmarNamibiaNauruNepalNetherlandsNew CaledoniaNew ZealandNicaraguaNigerNigeriaNorth AmericaNorthern Mariana IslandsNorwayOECD membersOmanOther small statesPacific island small statesPakistanPalauPanamaPapua New GuineaParaguayPeruPhilippinesPolandPortugalPost-demographic dividendPre-demographic dividendPuerto RicoQatarRomaniaRussian FederationRwandaSamoaSan MarinoSao Tome and PrincipeSaudi ArabiaSenegalSerbiaSeychellesSierra LeoneSingaporeSint Maarten (Dutch part)Slovak RepublicSloveniaSmall statesSolomon IslandsSomaliaSouth AfricaSouth AsiaSouth Asia (IDA & IBRD)South SudanSpainSri LankaSt. Kitts and NevisSt. LuciaSt. Vincent and the GrenadinesSub-Saharan Africa Sub-Saharan Africa (excluding high income)Sub-Saharan Africa (IDA & IBRD countries)SudanSurinameSwazilandSwedenSwitzerlandSyrian Arab RepublicTajikistanTanzaniaThailandTimor-LesteTogoTongaTrinidad and TobagoTunisiaTurkeyTurkmenistanTurks and Caicos IslandsTuvaluUgandaUkraineUnited Arab EmiratesUnited KingdomUnited StatesUpper middle incomeUruguayUzbekistanVanuatuVenezuela, RBVietnamVirgin Islands (U.S.)West Bank and GazaWorldYemen, Rep.ZambiaZimbabwe línea de tiempo (timeline):
En esta escala de tiempo se presenta un gráfico de 1961 y 2016 de Guyana. Los datos de 1960 están ausentes. El número de observaciones reales por fecha: 56.
Fuente (nombre):
Indicadores del desarrollo mundial
Fuente (organización):
United Nations, World Urbanization Prospects.
Categorías:
Climate Change, Urban Development
Se ha actualizado:
23 abr 2017 año
Los indicadores de los cambios de valor en los últimos años
Mínimo:
28.218
1 ene 2009 año
Máximo:
30.488
1 ene 1981 año
A la fecha de observación
Valor
Cambio absoluto
El cambio con respecto al valor anterior
1 ene 1961 año
29.009
+29.009
0.0%
1 ene 1962 año
29.049
+0.04
0.14%
1 ene 1963 año
29.089
+0.04
0.14%
1 ene 1964 año
29.129
+0.04
0.14%
1 ene 1965 año
29.169
+0.04
0.14%
1 ene 1966 año
29.209
+0.04
0.14%
1 ene 1967 año
29.249
+0.04
0.14%
1 ene 1968 año
29.289
+0.04
0.14%
1 ene 1969 año
29.329
+0.04
0.14%
1 ene 1970 año
29.369
+0.04
0.14%
1 ene 1971 año
29.425
+0.056
0.19%
1 ene 1972 año
29.533
+0.108
0.37%
1 ene 1973 año
29.641
+0.108
0.37%
1 ene 1974 año
29.75
+0.109
0.37%
1 ene 1975 año
29.858
+0.108
0.36%
1 ene 1976 año
29.967
+0.109
0.37%
1 ene 1977 año
30.076
+0.109
0.36%
1 ene 1978 año
30.186
+0.11
0.37%
1 ene 1979 año
30.295
+0.109
0.36%
1 ene 1980 año
30.405
+0.11
0.36%
1 ene 1981 año
30.488
+0.083
0.27%
1 ene 1982 año
30.396
-0.092
-0.3%
1 ene 1983 año
30.305
-0.091
-0.3%
1 ene 1984 año
30.215
-0.09
-0.3%
1 ene 1985 año
30.124
-0.091
-0.3%
1 ene 1986 año
30.033
-0.091
-0.3%
1 ene 1987 año
29.943
-0.09
-0.3%
1 ene 1988 año
29.853
-0.09
-0.3%
1 ene 1989 año
29.763
-0.09
-0.3%
1 ene 1990 año
29.673
-0.09
-0.3%
1 ene 1991 año
29.583
-0.09
-0.3%
1 ene 1992 año
29.493
-0.09
-0.3%
1 ene 1993 año
29.404
-0.089
-0.3%
1 ene 1994 año
29.315
-0.089
-0.3%
1 ene 1995 año
29.226
-0.089
-0.3%
1 ene 1996 año
29.137
-0.089
-0.3%
1 ene 1997 año
29.048
-0.089
-0.31%
1 ene 1998 año
28.959
-0.089
-0.31%
1 ene 1999 año
28.871
-0.088
-0.3%
1 ene 2000 año
28.782
-0.089
-0.31%
1 ene 2001 año
28.694
-0.088
-0.31%
1 ene 2002 año
28.606
-0.088
-0.31%
1 ene 2003 año
28.518
-0.088
-0.31%
1 ene 2004 año
28.431
-0.087
-0.31%
1 ene 2005 año
28.358
-0.073
-0.26%
1 ene 2006 año
28.301
-0.057
-0.2%
1 ene 2007 año
28.258
-0.043
-0.15%
1 ene 2008 año
28.231
-0.027
-0.1%
1 ene 2009 año
28.218
-0.013
-0.05%
1 ene 2010 año
28.221
+0.003
0.01%
1 ene 2011 año
28.239
+0.018
0.06%
1 ene 2012 año
28.271
+0.032
0.11%
1 ene 2013 año
28.319
+0.048
0.17%
1 ene 2014 año
28.382
+0.063
0.22%
1 ene 2015 año
28.459
+0.077
0.27%
1 ene 2016 año
28.553
+0.094
0.33%
Ranking de los países por los datos estadísticos actuales


Comentarios: