29
/es/
es
AIzaSyAYiBZKx7MnpbEhh9jyipgxe19OcubqV5w
April 1, 2024
274447
Ukraine
UKR
true
2
1
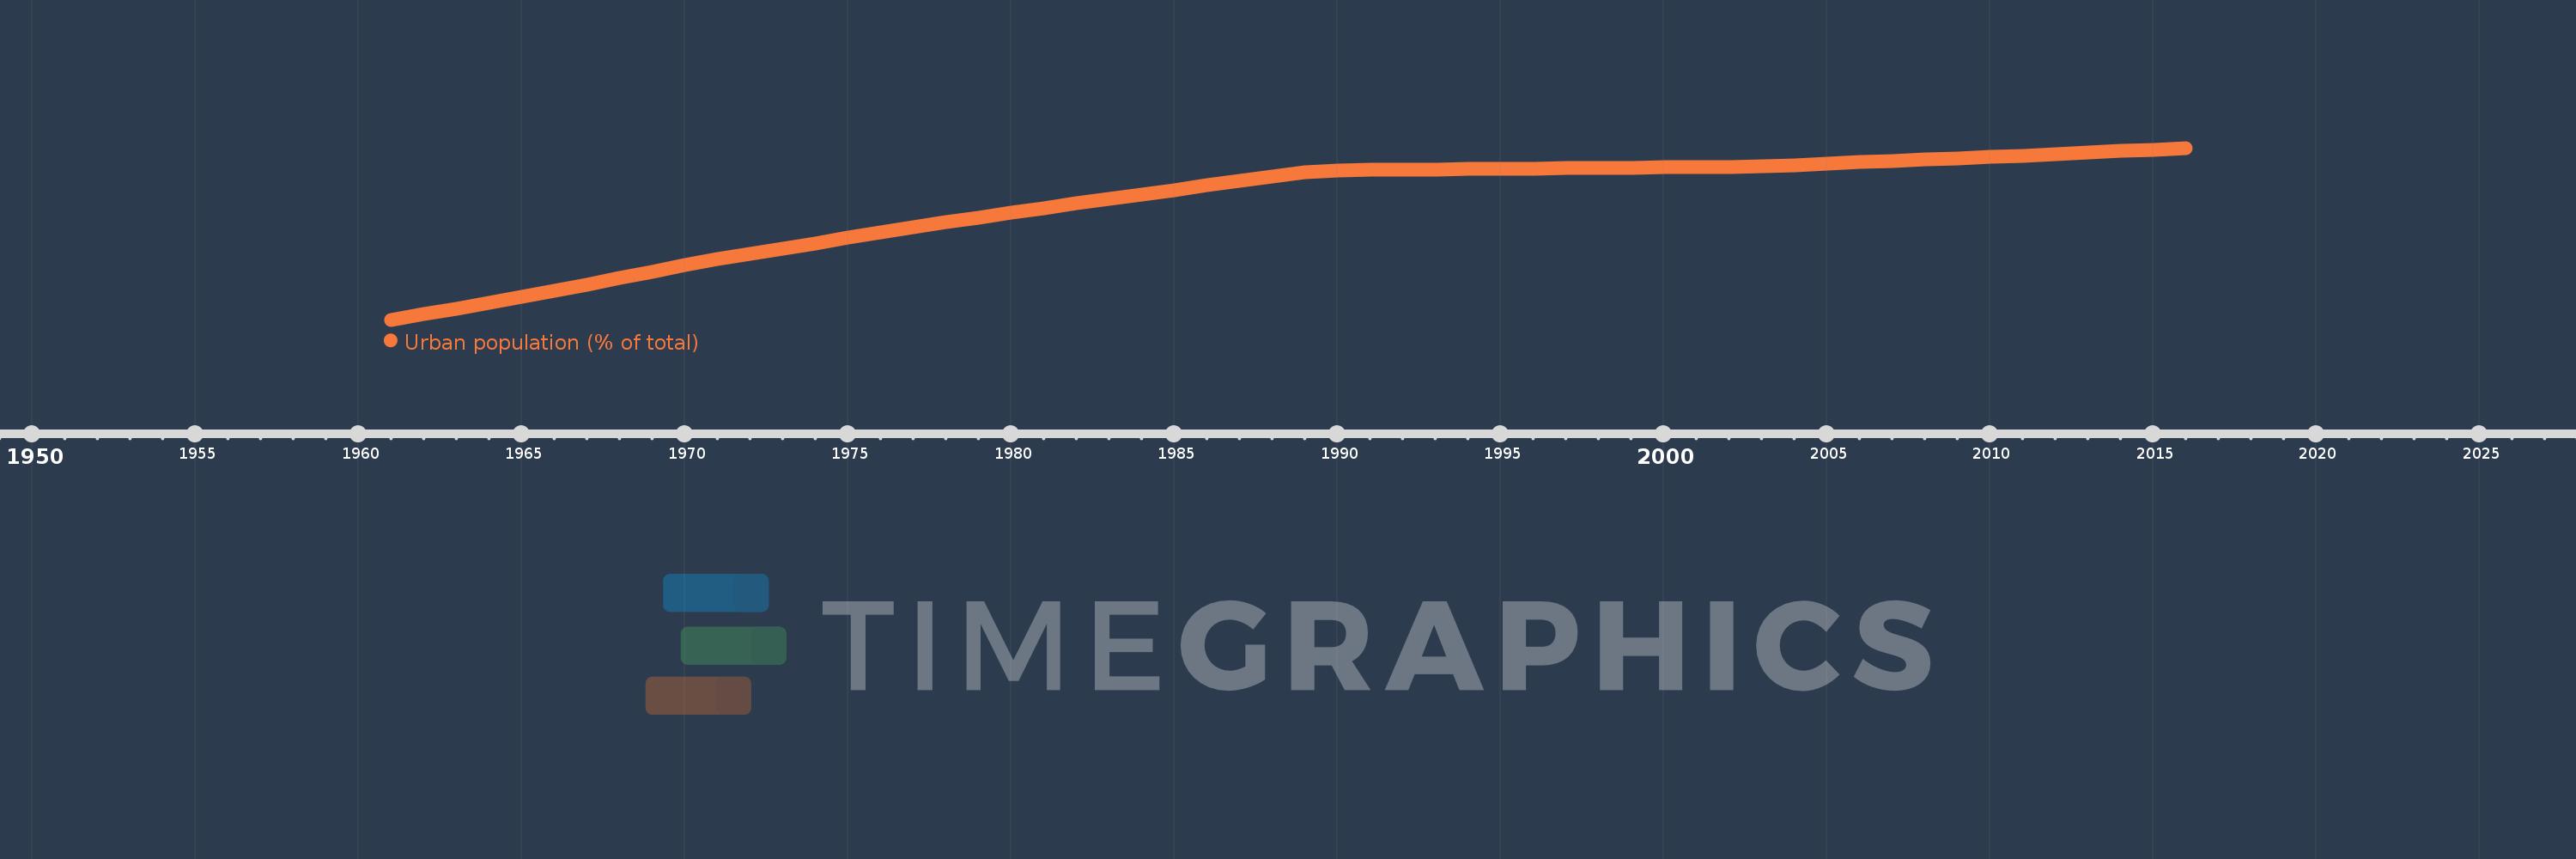
Urban population (% of total)
2016,2015,2014,2013,2012,2011,2010,2009,2008,2007,2006,2005,2004,2003,2002,2001,2000,1999,1998,1997,1996,1995,1994,1993,1992,1991,1990,1989,1988,1987,1986,1985,1984,1983,1982,1981,1980,1979,1978,1977,1976,1975,1974,1973,1972,1971,1970,1969,1968,1967,1966,1965,1964,1963,1962,1961
Estas estadísticas en otros países:
AfghanistanAlbaniaAlgeriaAmerican SamoaAndorraAngolaAntigua and BarbudaArab WorldArgentinaArmeniaArubaAustraliaAustriaAzerbaijanBahamas, TheBahrainBangladeshBarbadosBelarusBelgiumBelizeBeninBermudaBhutanBoliviaBosnia and HerzegovinaBotswanaBrazilBritish Virgin IslandsBrunei DarussalamBulgariaBurkina FasoBurundiCabo VerdeCambodiaCameroonCanadaCaribbean small statesCayman IslandsCentral African RepublicCentral Europe and the BalticsChadChannel IslandsChileChinaColombiaComorosCongo, Dem. Rep.Congo, Rep.Costa RicaCote d'IvoireCroatiaCubaCuracaoCyprusCzech RepublicDenmarkDjiboutiDominicaDominican RepublicEarly-demographic dividendEast Asia & PacificEast Asia & Pacific (excluding high income)East Asia & Pacific (IDA & IBRD countries)EcuadorEgypt, Arab Rep.El SalvadorEquatorial GuineaEritreaEstoniaEthiopiaEuro areaEurope & Central AsiaEurope & Central Asia (excluding high income)Europe & Central Asia (IDA & IBRD countries)European UnionFaroe IslandsFijiFinlandFragile and conflict affected situationsFranceFrench PolynesiaGabonGambia, TheGeorgiaGermanyGhanaGibraltarGreeceGreenlandGrenadaGuamGuatemalaGuineaGuinea-BissauGuyanaHaitiHeavily indebted poor countries (HIPC)High incomeHondurasHong Kong SAR, ChinaHungaryIBRD onlyIcelandIDA & IBRD totalIDA blendIDA onlyIDA totalIndiaIndonesiaIran, Islamic Rep.IraqIrelandIsle of ManIsraelItalyJamaicaJapanJordanKazakhstanKenyaKiribatiKorea, Dem. People’s Rep.Korea, Rep.KuwaitKyrgyz RepublicLao PDRLate-demographic dividendLatin America & Caribbean Latin America & Caribbean (excluding high income)Latin America & the Caribbean (IDA & IBRD countries)LatviaLeast developed countries: UN classificationLebanonLesothoLiberiaLibyaLiechtensteinLithuaniaLow & middle incomeLow incomeLower middle incomeLuxembourgMacao SAR, ChinaMacedonia, FYRMadagascarMalawiMalaysiaMaldivesMaliMaltaMarshall IslandsMauritaniaMauritiusMexicoMicronesia, Fed. Sts.Middle East & North AfricaMiddle East & North Africa (excluding high income)Middle East & North Africa (IDA & IBRD countries)Middle incomeMoldovaMonacoMongoliaMontenegroMoroccoMozambiqueMyanmarNamibiaNauruNepalNetherlandsNew CaledoniaNew ZealandNicaraguaNigerNigeriaNorth AmericaNorthern Mariana IslandsNorwayOECD membersOmanOther small statesPacific island small statesPakistanPalauPanamaPapua New GuineaParaguayPeruPhilippinesPolandPortugalPost-demographic dividendPre-demographic dividendPuerto RicoQatarRomaniaRussian FederationRwandaSamoaSan MarinoSao Tome and PrincipeSaudi ArabiaSenegalSerbiaSeychellesSierra LeoneSingaporeSint Maarten (Dutch part)Slovak RepublicSloveniaSmall statesSolomon IslandsSomaliaSouth AfricaSouth AsiaSouth Asia (IDA & IBRD)South SudanSpainSri LankaSt. Kitts and NevisSt. LuciaSt. Vincent and the GrenadinesSub-Saharan Africa Sub-Saharan Africa (excluding high income)Sub-Saharan Africa (IDA & IBRD countries)SudanSurinameSwazilandSwedenSwitzerlandSyrian Arab RepublicTajikistanTanzaniaThailandTimor-LesteTogoTongaTrinidad and TobagoTunisiaTurkeyTurkmenistanTurks and Caicos IslandsTuvaluUgandaUkraineUnited Arab EmiratesUnited KingdomUnited StatesUpper middle incomeUruguayUzbekistanVanuatuVenezuela, RBVietnamVirgin Islands (U.S.)West Bank and GazaWorldYemen, Rep.ZambiaZimbabwe línea de tiempo (timeline):
En esta escala de tiempo se presenta un gráfico de 1961 y 2016 de Ukraine. Los datos de 1960 están ausentes. El número de observaciones reales por fecha: 56.
Fuente (nombre):
Indicadores del desarrollo mundial
Fuente (organización):
United Nations, World Urbanization Prospects.
Categorías:
Climate Change, Urban Development
Se ha actualizado:
23 abr 2017 año
Los indicadores de los cambios de valor en los últimos años
Mínimo:
46.792
1 ene 1961 año
Máximo:
69.695
1 ene 2016 año
A la fecha de observación
Valor
Cambio absoluto
El cambio con respecto al valor anterior
1 ene 1961 año
46.792
+46.792
0.0%
1 ene 1962 año
47.542
+0.75
1.6%
1 ene 1963 año
48.294
+0.752
1.58%
1 ene 1964 año
49.046
+0.752
1.56%
1 ene 1965 año
49.8
+0.754
1.54%
1 ene 1966 año
50.649
+0.849
1.7%
1 ene 1967 año
51.499
+0.85
1.68%
1 ene 1968 año
52.348
+0.849
1.65%
1 ene 1969 año
53.197
+0.849
1.62%
1 ene 1970 año
54.042
+0.845
1.59%
1 ene 1971 año
54.831
+0.789
1.46%
1 ene 1972 año
55.552
+0.721
1.31%
1 ene 1973 año
56.272
+0.72
1.3%
1 ene 1974 año
56.987
+0.715
1.27%
1 ene 1975 año
57.7
+0.713
1.25%
1 ene 1976 año
58.389
+0.689
1.19%
1 ene 1977 año
59.075
+0.686
1.17%
1 ene 1978 año
59.756
+0.681
1.15%
1 ene 1979 año
60.434
+0.678
1.13%
1 ene 1980 año
61.081
+0.647
1.07%
1 ene 1981 año
61.693
+0.612
1.0%
1 ene 1982 año
62.3
+0.607
0.98%
1 ene 1983 año
62.904
+0.604
0.97%
1 ene 1984 año
63.504
+0.6
0.95%
1 ene 1985 año
64.1
+0.596
0.94%
1 ene 1986 año
64.681
+0.581
0.91%
1 ene 1987 año
65.258
+0.577
0.89%
1 ene 1988 año
65.83
+0.572
0.88%
1 ene 1989 año
66.399
+0.569
0.86%
1 ene 1990 año
66.718
+0.319
0.48%
1 ene 1991 año
66.757
+0.039
0.06%
1 ene 1992 año
66.796
+0.039
0.06%
1 ene 1993 año
66.835
+0.039
0.06%
1 ene 1994 año
66.874
+0.039
0.06%
1 ene 1995 año
66.912
+0.038
0.06%
1 ene 1996 año
66.951
+0.039
0.06%
1 ene 1997 año
66.99
+0.039
0.06%
1 ene 1998 año
67.029
+0.039
0.06%
1 ene 1999 año
67.067
+0.038
0.06%
1 ene 2000 año
67.106
+0.039
0.06%
1 ene 2001 año
67.145
+0.039
0.06%
1 ene 2002 año
67.183
+0.038
0.06%
1 ene 2003 año
67.283
+0.1
0.15%
1 ene 2004 año
67.427
+0.144
0.21%
1 ene 2005 año
67.597
+0.17
0.25%
1 ene 2006 año
67.79
+0.193
0.29%
1 ene 2007 año
67.969
+0.179
0.26%
1 ene 2008 año
68.147
+0.178
0.26%
1 ene 2009 año
68.325
+0.178
0.26%
1 ene 2010 año
68.502
+0.177
0.26%
1 ene 2011 año
68.686
+0.184
0.27%
1 ene 2012 año
68.876
+0.19
0.28%
1 ene 2013 año
69.072
+0.196
0.28%
1 ene 2014 año
69.274
+0.202
0.29%
1 ene 2015 año
69.482
+0.208
0.3%
1 ene 2016 año
69.695
+0.213
0.31%
Ranking de los países por los datos estadísticos actuales


Comentarios: