29
/es/
es
AIzaSyAYiBZKx7MnpbEhh9jyipgxe19OcubqV5w
April 1, 2024
145242
Guatemala
GTM
true
2
1
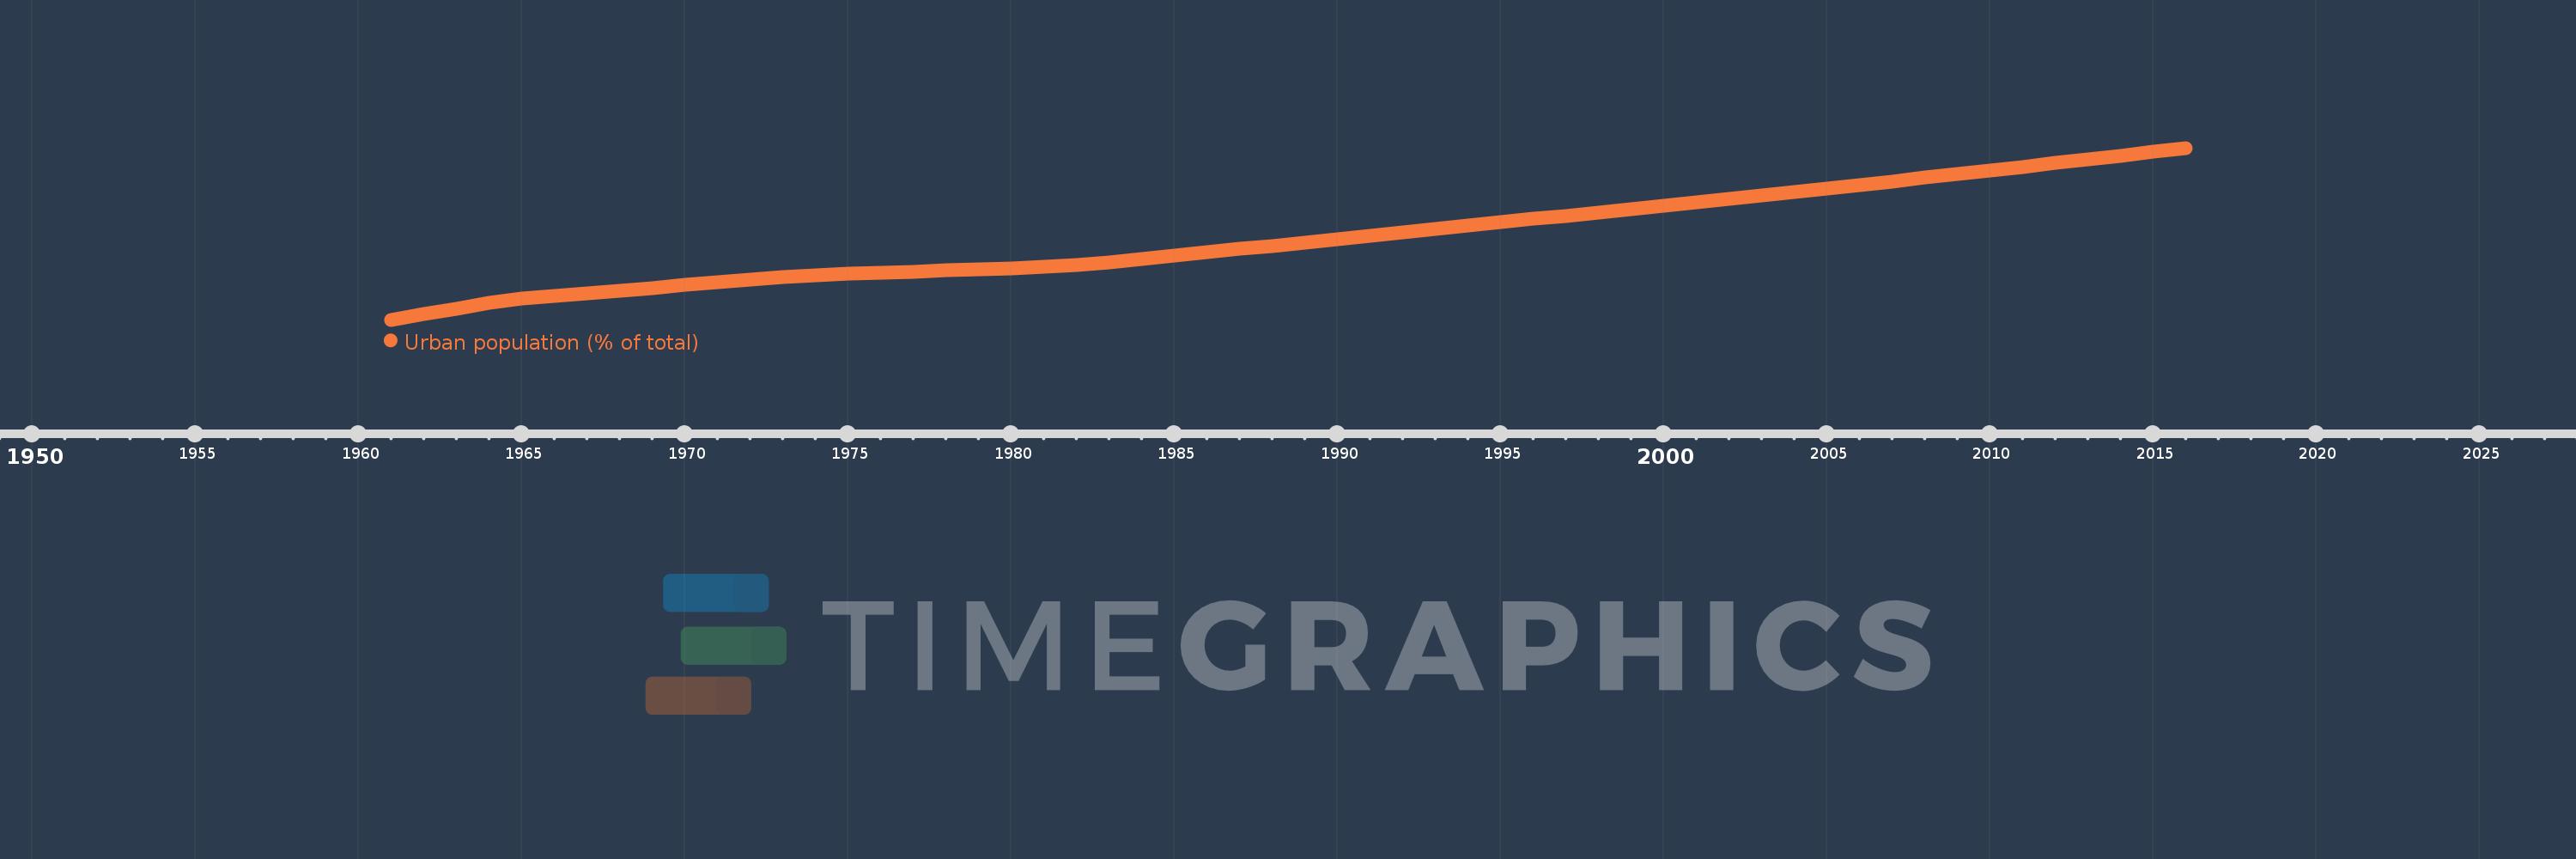
Urban population (% of total)
2016,2015,2014,2013,2012,2011,2010,2009,2008,2007,2006,2005,2004,2003,2002,2001,2000,1999,1998,1997,1996,1995,1994,1993,1992,1991,1990,1989,1988,1987,1986,1985,1984,1983,1982,1981,1980,1979,1978,1977,1976,1975,1974,1973,1972,1971,1970,1969,1968,1967,1966,1965,1964,1963,1962,1961
Estas estadísticas en otros países:
AfghanistanAlbaniaAlgeriaAmerican SamoaAndorraAngolaAntigua and BarbudaArab WorldArgentinaArmeniaArubaAustraliaAustriaAzerbaijanBahamas, TheBahrainBangladeshBarbadosBelarusBelgiumBelizeBeninBermudaBhutanBoliviaBosnia and HerzegovinaBotswanaBrazilBritish Virgin IslandsBrunei DarussalamBulgariaBurkina FasoBurundiCabo VerdeCambodiaCameroonCanadaCaribbean small statesCayman IslandsCentral African RepublicCentral Europe and the BalticsChadChannel IslandsChileChinaColombiaComorosCongo, Dem. Rep.Congo, Rep.Costa RicaCote d'IvoireCroatiaCubaCuracaoCyprusCzech RepublicDenmarkDjiboutiDominicaDominican RepublicEarly-demographic dividendEast Asia & PacificEast Asia & Pacific (excluding high income)East Asia & Pacific (IDA & IBRD countries)EcuadorEgypt, Arab Rep.El SalvadorEquatorial GuineaEritreaEstoniaEthiopiaEuro areaEurope & Central AsiaEurope & Central Asia (excluding high income)Europe & Central Asia (IDA & IBRD countries)European UnionFaroe IslandsFijiFinlandFragile and conflict affected situationsFranceFrench PolynesiaGabonGambia, TheGeorgiaGermanyGhanaGibraltarGreeceGreenlandGrenadaGuamGuatemalaGuineaGuinea-BissauGuyanaHaitiHeavily indebted poor countries (HIPC)High incomeHondurasHong Kong SAR, ChinaHungaryIBRD onlyIcelandIDA & IBRD totalIDA blendIDA onlyIDA totalIndiaIndonesiaIran, Islamic Rep.IraqIrelandIsle of ManIsraelItalyJamaicaJapanJordanKazakhstanKenyaKiribatiKorea, Dem. People’s Rep.Korea, Rep.KuwaitKyrgyz RepublicLao PDRLate-demographic dividendLatin America & Caribbean Latin America & Caribbean (excluding high income)Latin America & the Caribbean (IDA & IBRD countries)LatviaLeast developed countries: UN classificationLebanonLesothoLiberiaLibyaLiechtensteinLithuaniaLow & middle incomeLow incomeLower middle incomeLuxembourgMacao SAR, ChinaMacedonia, FYRMadagascarMalawiMalaysiaMaldivesMaliMaltaMarshall IslandsMauritaniaMauritiusMexicoMicronesia, Fed. Sts.Middle East & North AfricaMiddle East & North Africa (excluding high income)Middle East & North Africa (IDA & IBRD countries)Middle incomeMoldovaMonacoMongoliaMontenegroMoroccoMozambiqueMyanmarNamibiaNauruNepalNetherlandsNew CaledoniaNew ZealandNicaraguaNigerNigeriaNorth AmericaNorthern Mariana IslandsNorwayOECD membersOmanOther small statesPacific island small statesPakistanPalauPanamaPapua New GuineaParaguayPeruPhilippinesPolandPortugalPost-demographic dividendPre-demographic dividendPuerto RicoQatarRomaniaRussian FederationRwandaSamoaSan MarinoSao Tome and PrincipeSaudi ArabiaSenegalSerbiaSeychellesSierra LeoneSingaporeSint Maarten (Dutch part)Slovak RepublicSloveniaSmall statesSolomon IslandsSomaliaSouth AfricaSouth AsiaSouth Asia (IDA & IBRD)South SudanSpainSri LankaSt. Kitts and NevisSt. LuciaSt. Vincent and the GrenadinesSub-Saharan Africa Sub-Saharan Africa (excluding high income)Sub-Saharan Africa (IDA & IBRD countries)SudanSurinameSwazilandSwedenSwitzerlandSyrian Arab RepublicTajikistanTanzaniaThailandTimor-LesteTogoTongaTrinidad and TobagoTunisiaTurkeyTurkmenistanTurks and Caicos IslandsTuvaluUgandaUkraineUnited Arab EmiratesUnited KingdomUnited StatesUpper middle incomeUruguayUzbekistanVanuatuVenezuela, RBVietnamVirgin Islands (U.S.)West Bank and GazaWorldYemen, Rep.ZambiaZimbabwe línea de tiempo (timeline):
En esta escala de tiempo se presenta un gráfico de 1961 y 2016 de Guatemala. Los datos de 1960 están ausentes. El número de observaciones reales por fecha: 56.
Fuente (nombre):
Indicadores del desarrollo mundial
Fuente (organización):
United Nations, World Urbanization Prospects.
Categorías:
Climate Change, Urban Development
Se ha actualizado:
23 abr 2017 año
Los indicadores de los cambios de valor en los últimos años
Mínimo:
31.121
1 ene 1961 año
Máximo:
51.571
1 ene 2016 año
A la fecha de observación
Valor
Cambio absoluto
El cambio con respecto al valor anterior
1 ene 1961 año
31.121
+31.121
0.0%
1 ene 1962 año
31.768
+0.647
2.08%
1 ene 1963 año
32.424
+0.656
2.06%
1 ene 1964 año
33.086
+0.662
2.04%
1 ene 1965 año
33.682
+0.596
1.8%
1 ene 1966 año
33.989
+0.307
0.91%
1 ene 1967 año
34.298
+0.309
0.91%
1 ene 1968 año
34.608
+0.31
0.9%
1 ene 1969 año
34.919
+0.311
0.9%
1 ene 1970 año
35.232
+0.313
0.9%
1 ene 1971 año
35.545
+0.313
0.89%
1 ene 1972 año
35.861
+0.316
0.89%
1 ene 1973 año
36.177
+0.316
0.88%
1 ene 1974 año
36.446
+0.269
0.74%
1 ene 1975 año
36.582
+0.136
0.37%
1 ene 1976 año
36.718
+0.136
0.37%
1 ene 1977 año
36.854
+0.136
0.37%
1 ene 1978 año
36.99
+0.136
0.37%
1 ene 1979 año
37.127
+0.137
0.37%
1 ene 1980 año
37.263
+0.136
0.37%
1 ene 1981 año
37.401
+0.138
0.37%
1 ene 1982 año
37.605
+0.204
0.55%
1 ene 1983 año
37.99
+0.385
1.02%
1 ene 1984 año
38.376
+0.386
1.02%
1 ene 1985 año
38.764
+0.388
1.01%
1 ene 1986 año
39.152
+0.388
1.0%
1 ene 1987 año
39.543
+0.391
1.0%
1 ene 1988 año
39.934
+0.391
0.99%
1 ene 1989 año
40.328
+0.394
0.99%
1 ene 1990 año
40.721
+0.393
0.97%
1 ene 1991 año
41.117
+0.396
0.97%
1 ene 1992 año
41.513
+0.396
0.96%
1 ene 1993 año
41.912
+0.399
0.96%
1 ene 1994 año
42.31
+0.398
0.95%
1 ene 1995 año
42.71
+0.4
0.95%
1 ene 1996 año
43.11
+0.4
0.94%
1 ene 1997 año
43.512
+0.402
0.93%
1 ene 1998 año
43.914
+0.402
0.92%
1 ene 1999 año
44.318
+0.404
0.92%
1 ene 2000 año
44.722
+0.404
0.91%
1 ene 2001 año
45.127
+0.405
0.91%
1 ene 2002 año
45.532
+0.405
0.9%
1 ene 2003 año
45.937
+0.405
0.89%
1 ene 2004 año
46.344
+0.407
0.89%
1 ene 2005 año
46.756
+0.412
0.89%
1 ene 2006 año
47.172
+0.416
0.89%
1 ene 2007 año
47.593
+0.421
0.89%
1 ene 2008 año
48.019
+0.426
0.9%
1 ene 2009 año
48.449
+0.43
0.9%
1 ene 2010 año
48.884
+0.435
0.9%
1 ene 2011 año
49.323
+0.439
0.9%
1 ene 2012 año
49.765
+0.442
0.9%
1 ene 2013 año
50.212
+0.447
0.9%
1 ene 2014 año
50.661
+0.449
0.89%
1 ene 2015 año
51.115
+0.454
0.9%
1 ene 2016 año
51.571
+0.456
0.89%
Ranking de los países por los datos estadísticos actuales


Comentarios: