29
/es/
es
AIzaSyAYiBZKx7MnpbEhh9jyipgxe19OcubqV5w
April 1, 2024
108149
Colombia
COL
true
2
1
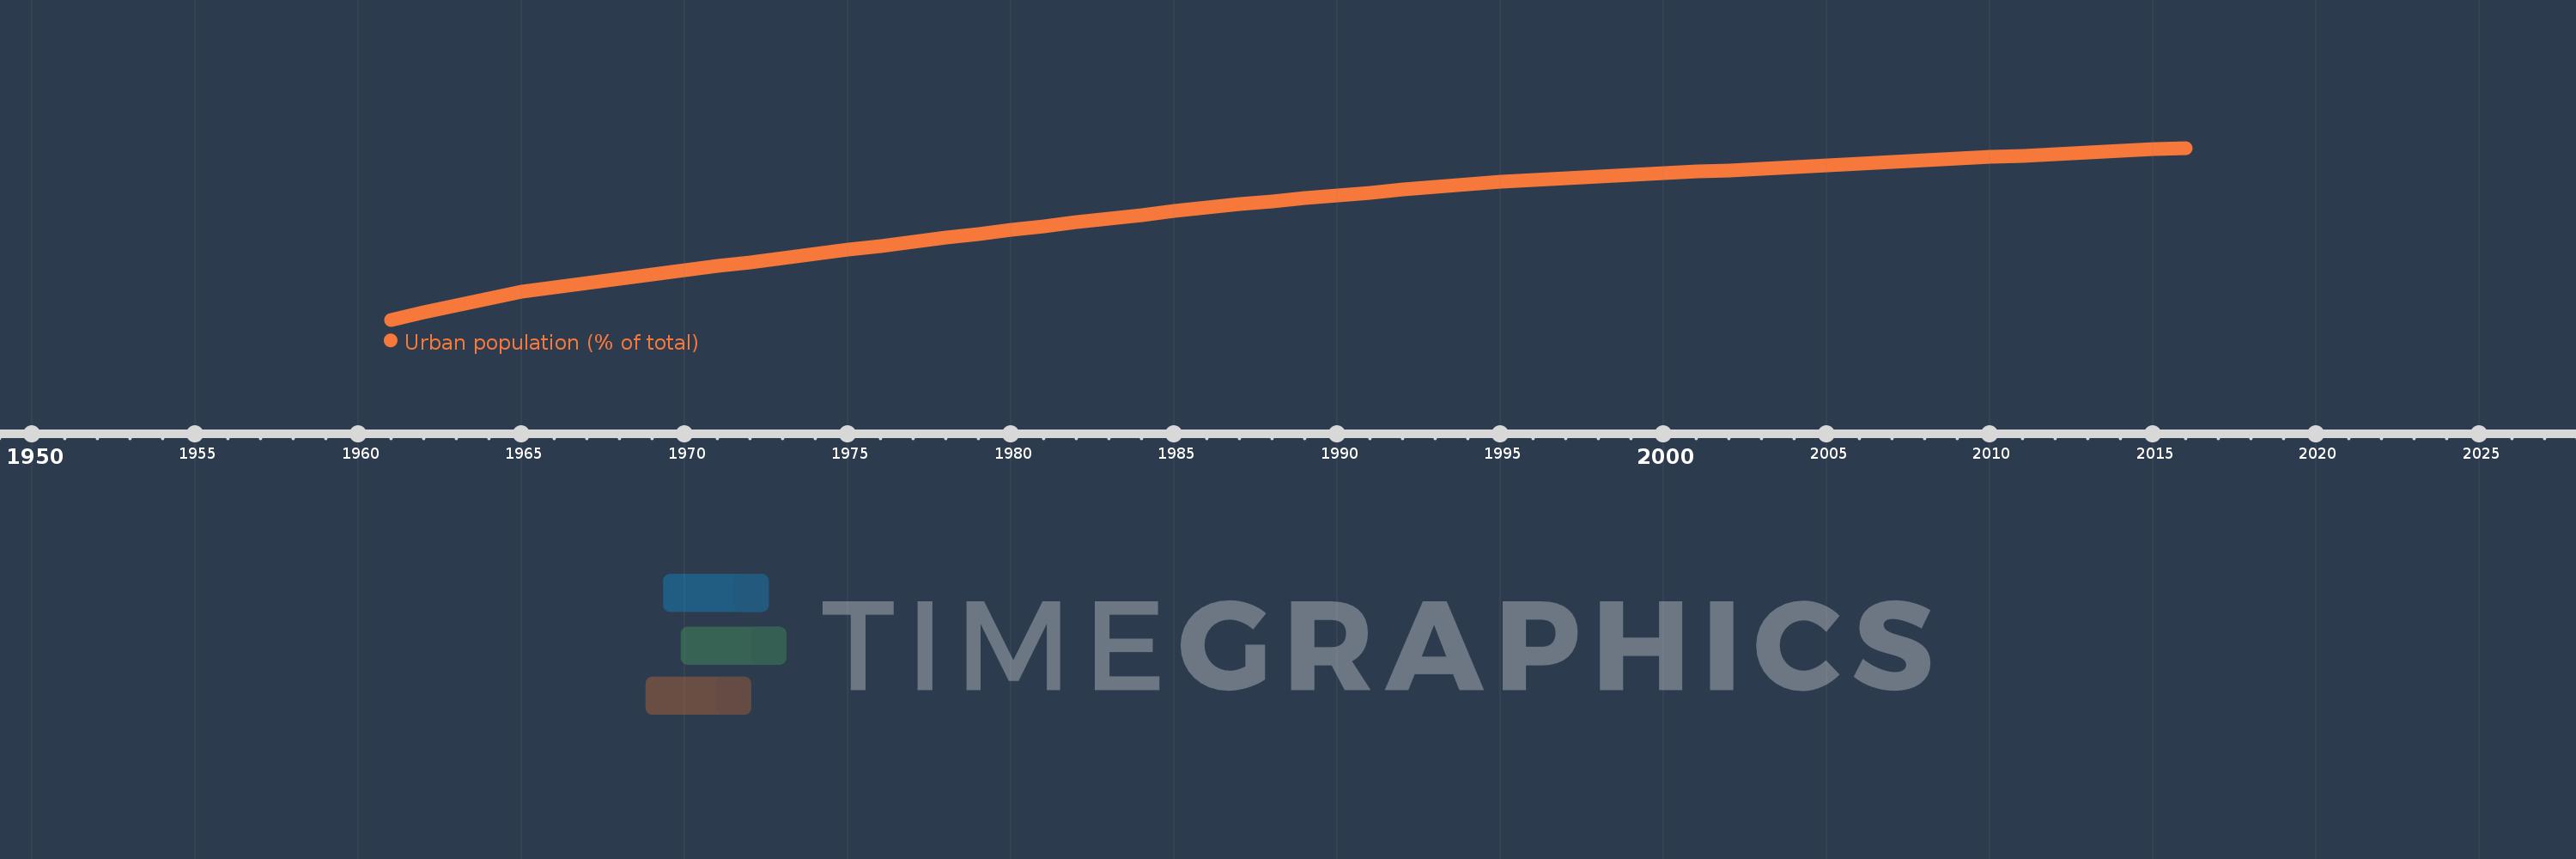
Urban population (% of total)
2016,2015,2014,2013,2012,2011,2010,2009,2008,2007,2006,2005,2004,2003,2002,2001,2000,1999,1998,1997,1996,1995,1994,1993,1992,1991,1990,1989,1988,1987,1986,1985,1984,1983,1982,1981,1980,1979,1978,1977,1976,1975,1974,1973,1972,1971,1970,1969,1968,1967,1966,1965,1964,1963,1962,1961
Estas estadísticas en otros países:
AfghanistanAlbaniaAlgeriaAmerican SamoaAndorraAngolaAntigua and BarbudaArab WorldArgentinaArmeniaArubaAustraliaAustriaAzerbaijanBahamas, TheBahrainBangladeshBarbadosBelarusBelgiumBelizeBeninBermudaBhutanBoliviaBosnia and HerzegovinaBotswanaBrazilBritish Virgin IslandsBrunei DarussalamBulgariaBurkina FasoBurundiCabo VerdeCambodiaCameroonCanadaCaribbean small statesCayman IslandsCentral African RepublicCentral Europe and the BalticsChadChannel IslandsChileChinaColombiaComorosCongo, Dem. Rep.Congo, Rep.Costa RicaCote d'IvoireCroatiaCubaCuracaoCyprusCzech RepublicDenmarkDjiboutiDominicaDominican RepublicEarly-demographic dividendEast Asia & PacificEast Asia & Pacific (excluding high income)East Asia & Pacific (IDA & IBRD countries)EcuadorEgypt, Arab Rep.El SalvadorEquatorial GuineaEritreaEstoniaEthiopiaEuro areaEurope & Central AsiaEurope & Central Asia (excluding high income)Europe & Central Asia (IDA & IBRD countries)European UnionFaroe IslandsFijiFinlandFragile and conflict affected situationsFranceFrench PolynesiaGabonGambia, TheGeorgiaGermanyGhanaGibraltarGreeceGreenlandGrenadaGuamGuatemalaGuineaGuinea-BissauGuyanaHaitiHeavily indebted poor countries (HIPC)High incomeHondurasHong Kong SAR, ChinaHungaryIBRD onlyIcelandIDA & IBRD totalIDA blendIDA onlyIDA totalIndiaIndonesiaIran, Islamic Rep.IraqIrelandIsle of ManIsraelItalyJamaicaJapanJordanKazakhstanKenyaKiribatiKorea, Dem. People’s Rep.Korea, Rep.KuwaitKyrgyz RepublicLao PDRLate-demographic dividendLatin America & Caribbean Latin America & Caribbean (excluding high income)Latin America & the Caribbean (IDA & IBRD countries)LatviaLeast developed countries: UN classificationLebanonLesothoLiberiaLibyaLiechtensteinLithuaniaLow & middle incomeLow incomeLower middle incomeLuxembourgMacao SAR, ChinaMacedonia, FYRMadagascarMalawiMalaysiaMaldivesMaliMaltaMarshall IslandsMauritaniaMauritiusMexicoMicronesia, Fed. Sts.Middle East & North AfricaMiddle East & North Africa (excluding high income)Middle East & North Africa (IDA & IBRD countries)Middle incomeMoldovaMonacoMongoliaMontenegroMoroccoMozambiqueMyanmarNamibiaNauruNepalNetherlandsNew CaledoniaNew ZealandNicaraguaNigerNigeriaNorth AmericaNorthern Mariana IslandsNorwayOECD membersOmanOther small statesPacific island small statesPakistanPalauPanamaPapua New GuineaParaguayPeruPhilippinesPolandPortugalPost-demographic dividendPre-demographic dividendPuerto RicoQatarRomaniaRussian FederationRwandaSamoaSan MarinoSao Tome and PrincipeSaudi ArabiaSenegalSerbiaSeychellesSierra LeoneSingaporeSint Maarten (Dutch part)Slovak RepublicSloveniaSmall statesSolomon IslandsSomaliaSouth AfricaSouth AsiaSouth Asia (IDA & IBRD)South SudanSpainSri LankaSt. Kitts and NevisSt. LuciaSt. Vincent and the GrenadinesSub-Saharan Africa Sub-Saharan Africa (excluding high income)Sub-Saharan Africa (IDA & IBRD countries)SudanSurinameSwazilandSwedenSwitzerlandSyrian Arab RepublicTajikistanTanzaniaThailandTimor-LesteTogoTongaTrinidad and TobagoTunisiaTurkeyTurkmenistanTurks and Caicos IslandsTuvaluUgandaUkraineUnited Arab EmiratesUnited KingdomUnited StatesUpper middle incomeUruguayUzbekistanVanuatuVenezuela, RBVietnamVirgin Islands (U.S.)West Bank and GazaWorldYemen, Rep.ZambiaZimbabwe línea de tiempo (timeline):
En esta escala de tiempo se presenta un gráfico de 1961 y 2016 de Colombia. Los datos de 1960 están ausentes. El número de observaciones reales por fecha: 56.
Fuente (nombre):
Indicadores del desarrollo mundial
Fuente (organización):
United Nations, World Urbanization Prospects.
Categorías:
Climate Change, Urban Development
Se ha actualizado:
23 abr 2017 año
Los indicadores de los cambios de valor en los últimos años
Mínimo:
45.033
1 ene 1961 año
Máximo:
76.436
1 ene 2016 año
A la fecha de observación
Valor
Cambio absoluto
El cambio con respecto al valor anterior
1 ene 1961 año
45.033
+45.033
0.0%
1 ene 1962 año
46.327
+1.294
2.87%
1 ene 1963 año
47.628
+1.301
2.81%
1 ene 1964 año
48.932
+1.304
2.74%
1 ene 1965 año
50.24
+1.308
2.67%
1 ene 1966 año
51.022
+0.782
1.56%
1 ene 1967 año
51.784
+0.762
1.49%
1 ene 1968 año
52.545
+0.761
1.47%
1 ene 1969 año
53.306
+0.761
1.45%
1 ene 1970 año
54.063
+0.757
1.42%
1 ene 1971 año
54.82
+0.757
1.4%
1 ene 1972 año
55.574
+0.754
1.38%
1 ene 1973 año
56.327
+0.753
1.35%
1 ene 1974 año
57.075
+0.748
1.33%
1 ene 1975 año
57.811
+0.736
1.29%
1 ene 1976 año
58.539
+0.728
1.26%
1 ene 1977 año
59.265
+0.726
1.24%
1 ene 1978 año
59.985
+0.72
1.21%
1 ene 1979 año
60.701
+0.716
1.19%
1 ene 1980 año
61.413
+0.712
1.17%
1 ene 1981 año
62.121
+0.708
1.15%
1 ene 1982 año
62.822
+0.701
1.13%
1 ene 1983 año
63.519
+0.697
1.11%
1 ene 1984 año
64.21
+0.691
1.09%
1 ene 1985 año
64.896
+0.686
1.07%
1 ene 1986 año
65.574
+0.678
1.04%
1 ene 1987 año
66.154
+0.58
0.88%
1 ene 1988 año
66.691
+0.537
0.81%
1 ene 1989 año
67.225
+0.534
0.8%
1 ene 1990 año
67.752
+0.527
0.78%
1 ene 1991 año
68.276
+0.524
0.77%
1 ene 1992 año
68.796
+0.52
0.76%
1 ene 1993 año
69.311
+0.515
0.75%
1 ene 1994 año
69.82
+0.509
0.73%
1 ene 1995 año
70.199
+0.379
0.54%
1 ene 1996 año
70.516
+0.317
0.45%
1 ene 1997 año
70.832
+0.316
0.45%
1 ene 1998 año
71.146
+0.314
0.44%
1 ene 1999 año
71.457
+0.311
0.44%
1 ene 2000 año
71.767
+0.31
0.43%
1 ene 2001 año
72.075
+0.308
0.43%
1 ene 2002 año
72.38
+0.305
0.42%
1 ene 2003 año
72.683
+0.303
0.42%
1 ene 2004 año
72.984
+0.301
0.41%
1 ene 2005 año
73.284
+0.3
0.41%
1 ene 2006 año
73.581
+0.297
0.41%
1 ene 2007 año
73.876
+0.295
0.4%
1 ene 2008 año
74.169
+0.293
0.4%
1 ene 2009 año
74.46
+0.291
0.39%
1 ene 2010 año
74.749
+0.289
0.39%
1 ene 2011 año
75.036
+0.287
0.38%
1 ene 2012 año
75.321
+0.285
0.38%
1 ene 2013 año
75.603
+0.282
0.37%
1 ene 2014 año
75.883
+0.28
0.37%
1 ene 2015 año
76.161
+0.278
0.37%
1 ene 2016 año
76.436
+0.275
0.36%
Ranking de los países por los datos estadísticos actuales


Comentarios: