29
/es/
es
AIzaSyAYiBZKx7MnpbEhh9jyipgxe19OcubqV5w
April 1, 2024
263138
Thailand
THA
true
2
1
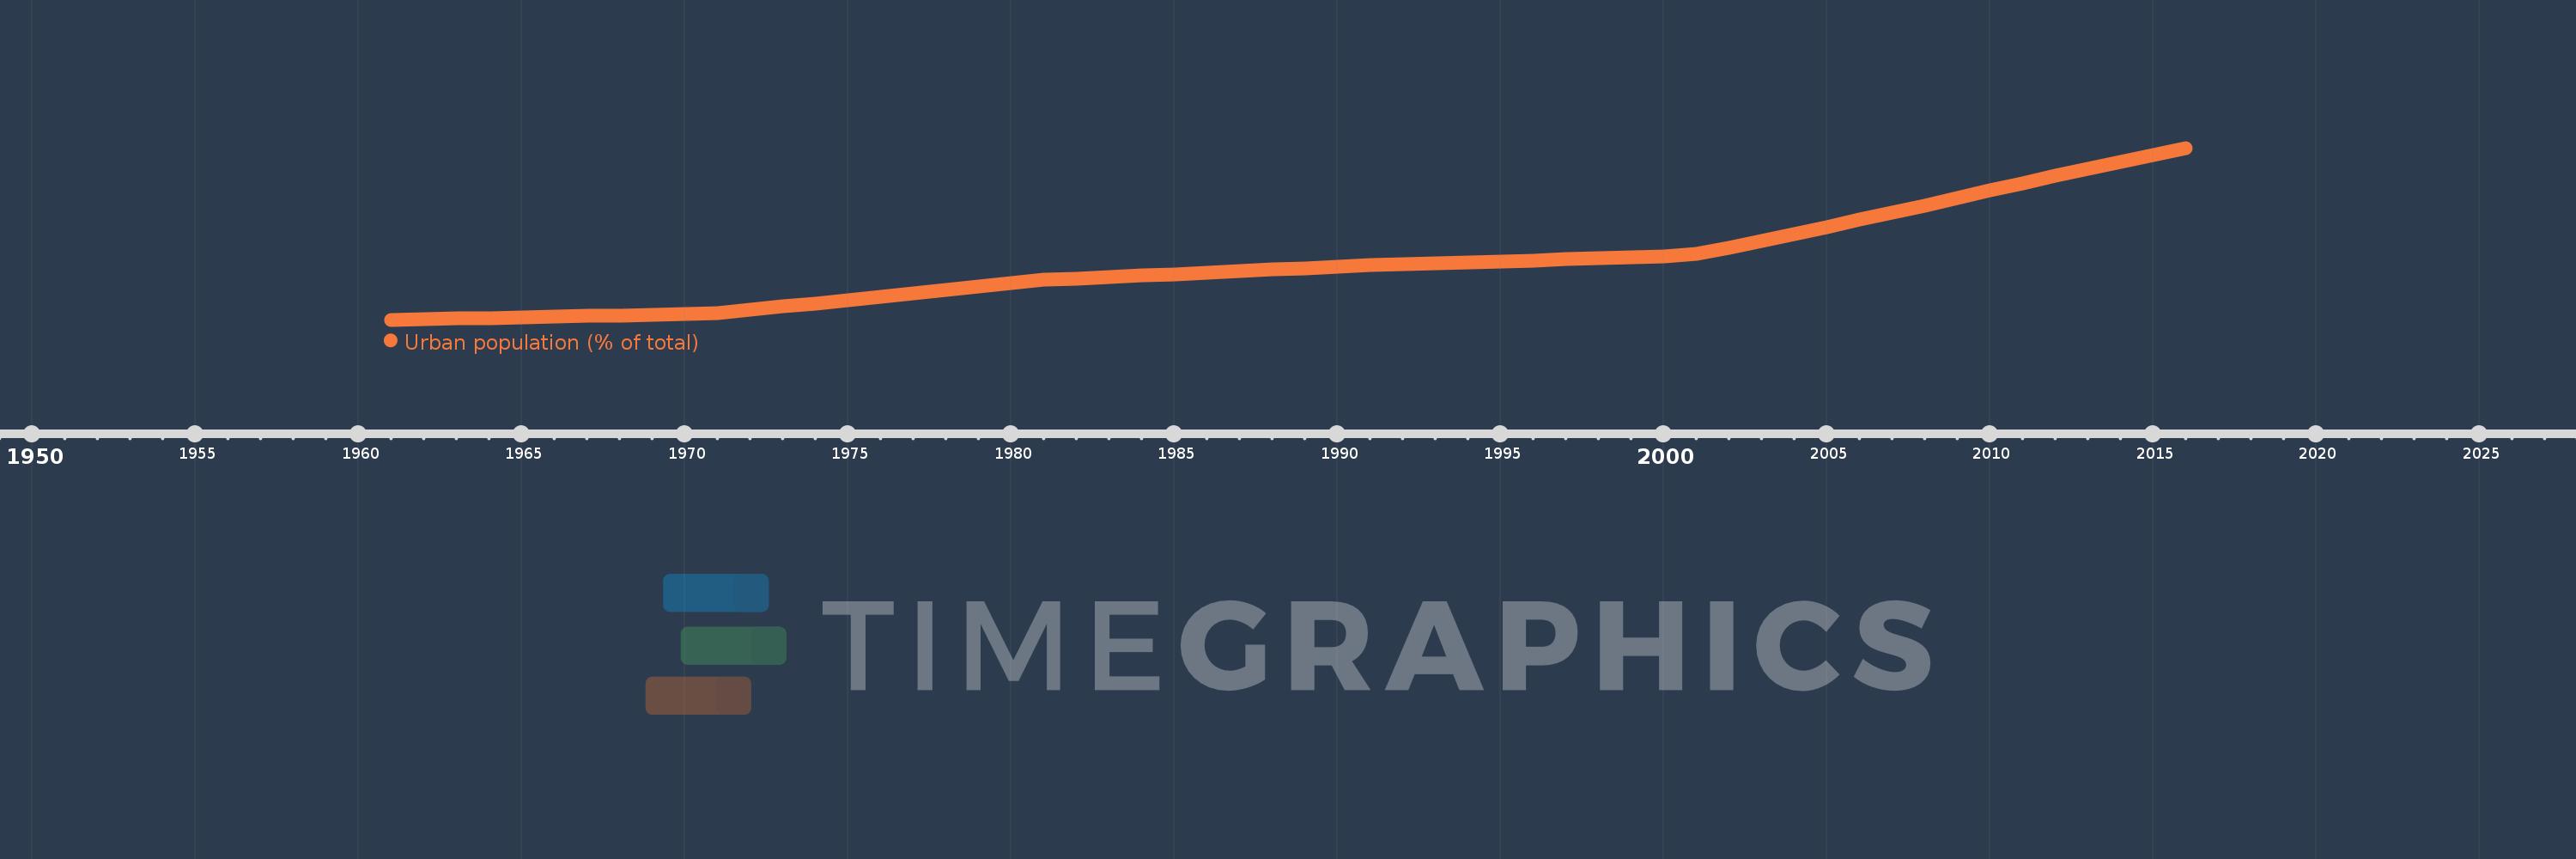
Urban population (% of total)
2016,2015,2014,2013,2012,2011,2010,2009,2008,2007,2006,2005,2004,2003,2002,2001,2000,1999,1998,1997,1996,1995,1994,1993,1992,1991,1990,1989,1988,1987,1986,1985,1984,1983,1982,1981,1980,1979,1978,1977,1976,1975,1974,1973,1972,1971,1970,1969,1968,1967,1966,1965,1964,1963,1962,1961
Estas estadísticas en otros países:
AfghanistanAlbaniaAlgeriaAmerican SamoaAndorraAngolaAntigua and BarbudaArab WorldArgentinaArmeniaArubaAustraliaAustriaAzerbaijanBahamas, TheBahrainBangladeshBarbadosBelarusBelgiumBelizeBeninBermudaBhutanBoliviaBosnia and HerzegovinaBotswanaBrazilBritish Virgin IslandsBrunei DarussalamBulgariaBurkina FasoBurundiCabo VerdeCambodiaCameroonCanadaCaribbean small statesCayman IslandsCentral African RepublicCentral Europe and the BalticsChadChannel IslandsChileChinaColombiaComorosCongo, Dem. Rep.Congo, Rep.Costa RicaCote d'IvoireCroatiaCubaCuracaoCyprusCzech RepublicDenmarkDjiboutiDominicaDominican RepublicEarly-demographic dividendEast Asia & PacificEast Asia & Pacific (excluding high income)East Asia & Pacific (IDA & IBRD countries)EcuadorEgypt, Arab Rep.El SalvadorEquatorial GuineaEritreaEstoniaEthiopiaEuro areaEurope & Central AsiaEurope & Central Asia (excluding high income)Europe & Central Asia (IDA & IBRD countries)European UnionFaroe IslandsFijiFinlandFragile and conflict affected situationsFranceFrench PolynesiaGabonGambia, TheGeorgiaGermanyGhanaGibraltarGreeceGreenlandGrenadaGuamGuatemalaGuineaGuinea-BissauGuyanaHaitiHeavily indebted poor countries (HIPC)High incomeHondurasHong Kong SAR, ChinaHungaryIBRD onlyIcelandIDA & IBRD totalIDA blendIDA onlyIDA totalIndiaIndonesiaIran, Islamic Rep.IraqIrelandIsle of ManIsraelItalyJamaicaJapanJordanKazakhstanKenyaKiribatiKorea, Dem. People’s Rep.Korea, Rep.KuwaitKyrgyz RepublicLao PDRLate-demographic dividendLatin America & Caribbean Latin America & Caribbean (excluding high income)Latin America & the Caribbean (IDA & IBRD countries)LatviaLeast developed countries: UN classificationLebanonLesothoLiberiaLibyaLiechtensteinLithuaniaLow & middle incomeLow incomeLower middle incomeLuxembourgMacao SAR, ChinaMacedonia, FYRMadagascarMalawiMalaysiaMaldivesMaliMaltaMarshall IslandsMauritaniaMauritiusMexicoMicronesia, Fed. Sts.Middle East & North AfricaMiddle East & North Africa (excluding high income)Middle East & North Africa (IDA & IBRD countries)Middle incomeMoldovaMonacoMongoliaMontenegroMoroccoMozambiqueMyanmarNamibiaNauruNepalNetherlandsNew CaledoniaNew ZealandNicaraguaNigerNigeriaNorth AmericaNorthern Mariana IslandsNorwayOECD membersOmanOther small statesPacific island small statesPakistanPalauPanamaPapua New GuineaParaguayPeruPhilippinesPolandPortugalPost-demographic dividendPre-demographic dividendPuerto RicoQatarRomaniaRussian FederationRwandaSamoaSan MarinoSao Tome and PrincipeSaudi ArabiaSenegalSerbiaSeychellesSierra LeoneSingaporeSint Maarten (Dutch part)Slovak RepublicSloveniaSmall statesSolomon IslandsSomaliaSouth AfricaSouth AsiaSouth Asia (IDA & IBRD)South SudanSpainSri LankaSt. Kitts and NevisSt. LuciaSt. Vincent and the GrenadinesSub-Saharan Africa Sub-Saharan Africa (excluding high income)Sub-Saharan Africa (IDA & IBRD countries)SudanSurinameSwazilandSwedenSwitzerlandSyrian Arab RepublicTajikistanTanzaniaThailandTimor-LesteTogoTongaTrinidad and TobagoTunisiaTurkeyTurkmenistanTurks and Caicos IslandsTuvaluUgandaUkraineUnited Arab EmiratesUnited KingdomUnited StatesUpper middle incomeUruguayUzbekistanVanuatuVenezuela, RBVietnamVirgin Islands (U.S.)West Bank and GazaWorldYemen, Rep.ZambiaZimbabwe línea de tiempo (timeline):
En esta escala de tiempo se presenta un gráfico de 1961 y 2016 de Thailand. Los datos de 1960 están ausentes. El número de observaciones reales por fecha: 56.
Fuente (nombre):
Indicadores del desarrollo mundial
Fuente (organización):
United Nations, World Urbanization Prospects.
Categorías:
Climate Change, Urban Development
Se ha actualizado:
23 abr 2017 año
Los indicadores de los cambios de valor en los últimos años
Mínimo:
19.672
1 ene 1961 año
Máximo:
50.374
1 ene 2016 año
A la fecha de observación
Valor
Cambio absoluto
El cambio con respecto al valor anterior
1 ene 1961 año
19.672
+19.672
0.0%
1 ene 1962 año
19.781
+0.109
0.55%
1 ene 1963 año
19.89
+0.109
0.55%
1 ene 1964 año
20.0
+0.11
0.55%
1 ene 1965 año
20.11
+0.11
0.55%
1 ene 1966 año
20.221
+0.111
0.55%
1 ene 1967 año
20.332
+0.111
0.55%
1 ene 1968 año
20.444
+0.112
0.55%
1 ene 1969 año
20.556
+0.112
0.55%
1 ene 1970 año
20.668
+0.112
0.54%
1 ene 1971 año
20.889
+0.221
1.07%
1 ene 1972 año
21.442
+0.553
2.65%
1 ene 1973 año
22.006
+0.564
2.63%
1 ene 1974 año
22.579
+0.573
2.6%
1 ene 1975 año
23.164
+0.585
2.59%
1 ene 1976 año
23.758
+0.594
2.56%
1 ene 1977 año
24.365
+0.607
2.55%
1 ene 1978 año
24.98
+0.615
2.52%
1 ene 1979 año
25.606
+0.626
2.51%
1 ene 1980 año
26.242
+0.636
2.48%
1 ene 1981 año
26.791
+0.549
2.09%
1 ene 1982 año
27.049
+0.258
0.96%
1 ene 1983 año
27.308
+0.259
0.96%
1 ene 1984 año
27.569
+0.261
0.96%
1 ene 1985 año
27.832
+0.263
0.95%
1 ene 1986 año
28.095
+0.263
0.94%
1 ene 1987 año
28.361
+0.266
0.95%
1 ene 1988 año
28.628
+0.267
0.94%
1 ene 1989 año
28.897
+0.269
0.94%
1 ene 1990 año
29.167
+0.27
0.93%
1 ene 1991 año
29.424
+0.257
0.88%
1 ene 1992 año
29.593
+0.169
0.57%
1 ene 1993 año
29.763
+0.17
0.57%
1 ene 1994 año
29.934
+0.171
0.57%
1 ene 1995 año
30.105
+0.171
0.57%
1 ene 1996 año
30.276
+0.171
0.57%
1 ene 1997 año
30.449
+0.173
0.57%
1 ene 1998 año
30.622
+0.173
0.57%
1 ene 1999 año
30.795
+0.173
0.56%
1 ene 2000 año
30.969
+0.174
0.57%
1 ene 2001 año
31.391
+0.422
1.36%
1 ene 2002 año
32.572
+1.181
3.76%
1 ene 2003 año
33.779
+1.207
3.71%
1 ene 2004 año
35.006
+1.227
3.63%
1 ene 2005 año
36.256
+1.25
3.57%
1 ene 2006 año
37.52
+1.264
3.49%
1 ene 2007 año
38.804
+1.284
3.42%
1 ene 2008 año
40.104
+1.3
3.35%
1 ene 2009 año
41.419
+1.315
3.28%
1 ene 2010 año
42.744
+1.325
3.2%
1 ene 2011 año
44.08
+1.336
3.13%
1 ene 2012 año
45.394
+1.314
2.98%
1 ene 2013 año
46.682
+1.288
2.84%
1 ene 2014 año
47.943
+1.261
2.7%
1 ene 2015 año
49.174
+1.231
2.57%
1 ene 2016 año
50.374
+1.2
2.44%
Ranking de los países por los datos estadísticos actuales


Comentarios: