29
/es/
es
AIzaSyAYiBZKx7MnpbEhh9jyipgxe19OcubqV5w
April 1, 2024
213806
Nigeria
NGA
true
2
1
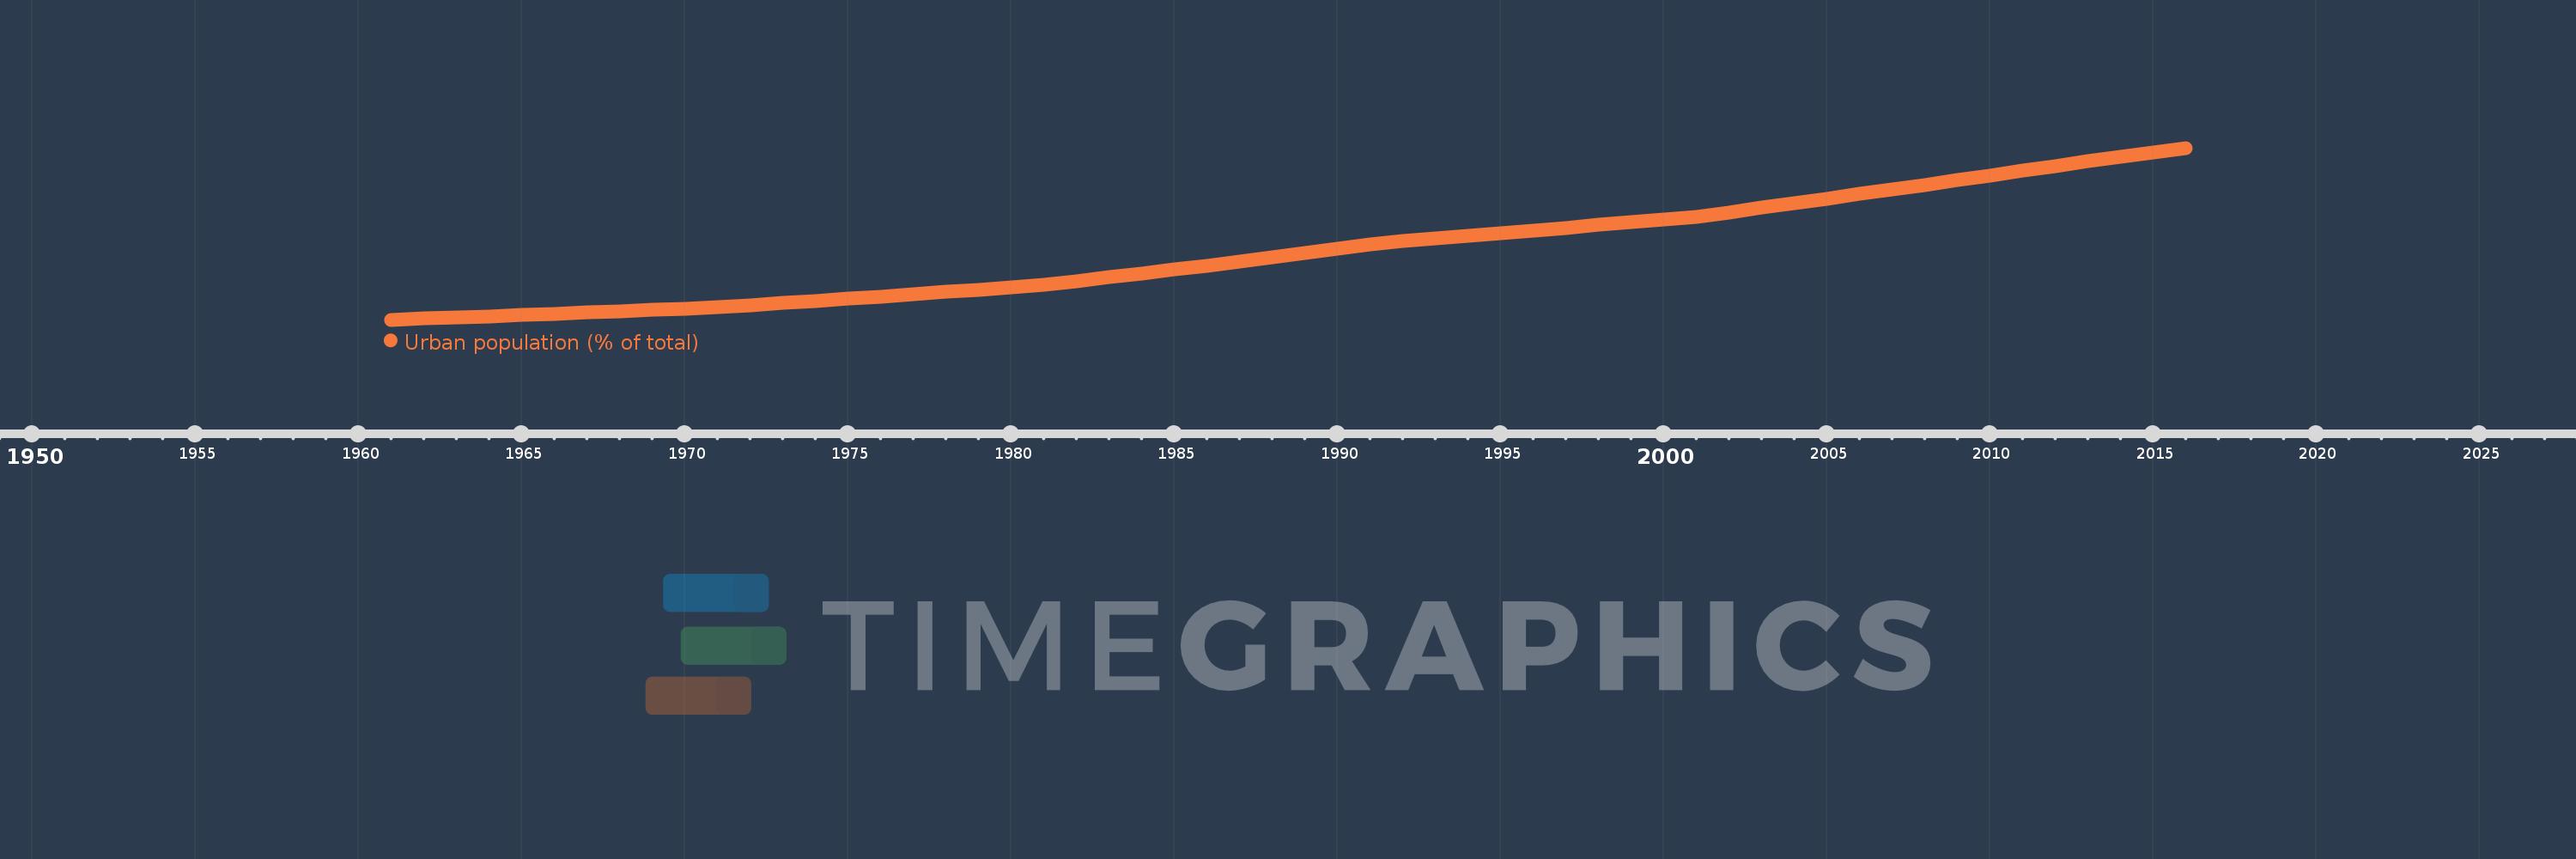
Urban population (% of total)
2016,2015,2014,2013,2012,2011,2010,2009,2008,2007,2006,2005,2004,2003,2002,2001,2000,1999,1998,1997,1996,1995,1994,1993,1992,1991,1990,1989,1988,1987,1986,1985,1984,1983,1982,1981,1980,1979,1978,1977,1976,1975,1974,1973,1972,1971,1970,1969,1968,1967,1966,1965,1964,1963,1962,1961
Estas estadísticas en otros países:
AfghanistanAlbaniaAlgeriaAmerican SamoaAndorraAngolaAntigua and BarbudaArab WorldArgentinaArmeniaArubaAustraliaAustriaAzerbaijanBahamas, TheBahrainBangladeshBarbadosBelarusBelgiumBelizeBeninBermudaBhutanBoliviaBosnia and HerzegovinaBotswanaBrazilBritish Virgin IslandsBrunei DarussalamBulgariaBurkina FasoBurundiCabo VerdeCambodiaCameroonCanadaCaribbean small statesCayman IslandsCentral African RepublicCentral Europe and the BalticsChadChannel IslandsChileChinaColombiaComorosCongo, Dem. Rep.Congo, Rep.Costa RicaCote d'IvoireCroatiaCubaCuracaoCyprusCzech RepublicDenmarkDjiboutiDominicaDominican RepublicEarly-demographic dividendEast Asia & PacificEast Asia & Pacific (excluding high income)East Asia & Pacific (IDA & IBRD countries)EcuadorEgypt, Arab Rep.El SalvadorEquatorial GuineaEritreaEstoniaEthiopiaEuro areaEurope & Central AsiaEurope & Central Asia (excluding high income)Europe & Central Asia (IDA & IBRD countries)European UnionFaroe IslandsFijiFinlandFragile and conflict affected situationsFranceFrench PolynesiaGabonGambia, TheGeorgiaGermanyGhanaGibraltarGreeceGreenlandGrenadaGuamGuatemalaGuineaGuinea-BissauGuyanaHaitiHeavily indebted poor countries (HIPC)High incomeHondurasHong Kong SAR, ChinaHungaryIBRD onlyIcelandIDA & IBRD totalIDA blendIDA onlyIDA totalIndiaIndonesiaIran, Islamic Rep.IraqIrelandIsle of ManIsraelItalyJamaicaJapanJordanKazakhstanKenyaKiribatiKorea, Dem. People’s Rep.Korea, Rep.KuwaitKyrgyz RepublicLao PDRLate-demographic dividendLatin America & Caribbean Latin America & Caribbean (excluding high income)Latin America & the Caribbean (IDA & IBRD countries)LatviaLeast developed countries: UN classificationLebanonLesothoLiberiaLibyaLiechtensteinLithuaniaLow & middle incomeLow incomeLower middle incomeLuxembourgMacao SAR, ChinaMacedonia, FYRMadagascarMalawiMalaysiaMaldivesMaliMaltaMarshall IslandsMauritaniaMauritiusMexicoMicronesia, Fed. Sts.Middle East & North AfricaMiddle East & North Africa (excluding high income)Middle East & North Africa (IDA & IBRD countries)Middle incomeMoldovaMonacoMongoliaMontenegroMoroccoMozambiqueMyanmarNamibiaNauruNepalNetherlandsNew CaledoniaNew ZealandNicaraguaNigerNigeriaNorth AmericaNorthern Mariana IslandsNorwayOECD membersOmanOther small statesPacific island small statesPakistanPalauPanamaPapua New GuineaParaguayPeruPhilippinesPolandPortugalPost-demographic dividendPre-demographic dividendPuerto RicoQatarRomaniaRussian FederationRwandaSamoaSan MarinoSao Tome and PrincipeSaudi ArabiaSenegalSerbiaSeychellesSierra LeoneSingaporeSint Maarten (Dutch part)Slovak RepublicSloveniaSmall statesSolomon IslandsSomaliaSouth AfricaSouth AsiaSouth Asia (IDA & IBRD)South SudanSpainSri LankaSt. Kitts and NevisSt. LuciaSt. Vincent and the GrenadinesSub-Saharan Africa Sub-Saharan Africa (excluding high income)Sub-Saharan Africa (IDA & IBRD countries)SudanSurinameSwazilandSwedenSwitzerlandSyrian Arab RepublicTajikistanTanzaniaThailandTimor-LesteTogoTongaTrinidad and TobagoTunisiaTurkeyTurkmenistanTurks and Caicos IslandsTuvaluUgandaUkraineUnited Arab EmiratesUnited KingdomUnited StatesUpper middle incomeUruguayUzbekistanVanuatuVenezuela, RBVietnamVirgin Islands (U.S.)West Bank and GazaWorldYemen, Rep.ZambiaZimbabwe línea de tiempo (timeline):
En esta escala de tiempo se presenta un gráfico de 1961 y 2016 de Nigeria. Los datos de 1960 están ausentes. El número de observaciones reales por fecha: 56.
Fuente (nombre):
Indicadores del desarrollo mundial
Fuente (organización):
United Nations, World Urbanization Prospects.
Categorías:
Climate Change, Urban Development
Se ha actualizado:
23 abr 2017 año
Los indicadores de los cambios de valor en los últimos años
Mínimo:
15.41
1 ene 1961 año
Máximo:
47.776
1 ene 2016 año
A la fecha de observación
Valor
Cambio absoluto
El cambio con respecto al valor anterior
1 ene 1961 año
15.41
+15.41
0.0%
1 ene 1962 año
15.633
+0.223
1.45%
1 ene 1963 año
15.858
+0.225
1.44%
1 ene 1964 año
16.087
+0.229
1.44%
1 ene 1965 año
16.318
+0.231
1.44%
1 ene 1966 año
16.551
+0.233
1.43%
1 ene 1967 año
16.788
+0.237
1.43%
1 ene 1968 año
17.027
+0.239
1.42%
1 ene 1969 año
17.269
+0.242
1.42%
1 ene 1970 año
17.513
+0.244
1.41%
1 ene 1971 año
17.76
+0.247
1.41%
1 ene 1972 año
18.151
+0.391
2.2%
1 ene 1973 año
18.549
+0.398
2.19%
1 ene 1974 año
18.952
+0.403
2.17%
1 ene 1975 año
19.363
+0.411
2.17%
1 ene 1976 año
19.78
+0.417
2.15%
1 ene 1977 año
20.205
+0.425
2.15%
1 ene 1978 año
20.636
+0.431
2.13%
1 ene 1979 año
21.074
+0.438
2.12%
1 ene 1980 año
21.518
+0.444
2.11%
1 ene 1981 año
21.97
+0.452
2.1%
1 ene 1982 año
22.671
+0.701
3.19%
1 ene 1983 año
23.389
+0.718
3.17%
1 ene 1984 año
24.122
+0.733
3.13%
1 ene 1985 año
24.872
+0.75
3.11%
1 ene 1986 año
25.635
+0.763
3.07%
1 ene 1987 año
26.414
+0.779
3.04%
1 ene 1988 año
27.209
+0.795
3.01%
1 ene 1989 año
28.019
+0.81
2.98%
1 ene 1990 año
28.842
+0.823
2.94%
1 ene 1991 año
29.68
+0.838
2.91%
1 ene 1992 año
30.176
+0.496
1.67%
1 ene 1993 año
30.677
+0.501
1.66%
1 ene 1994 año
31.182
+0.505
1.65%
1 ene 1995 año
31.691
+0.509
1.63%
1 ene 1996 año
32.205
+0.514
1.62%
1 ene 1997 año
32.725
+0.52
1.61%
1 ene 1998 año
33.247
+0.522
1.6%
1 ene 1999 año
33.773
+0.526
1.58%
1 ene 2000 año
34.304
+0.531
1.57%
1 ene 2001 año
34.84
+0.536
1.56%
1 ene 2002 año
35.669
+0.829
2.38%
1 ene 2003 año
36.508
+0.839
2.35%
1 ene 2004 año
37.356
+0.848
2.32%
1 ene 2005 año
38.212
+0.856
2.29%
1 ene 2006 año
39.074
+0.862
2.26%
1 ene 2007 año
39.943
+0.869
2.22%
1 ene 2008 año
40.819
+0.876
2.19%
1 ene 2009 año
41.702
+0.883
2.16%
1 ene 2010 año
42.588
+0.886
2.12%
1 ene 2011 año
43.48
+0.892
2.09%
1 ene 2012 año
44.362
+0.882
2.03%
1 ene 2013 año
45.234
+0.872
1.97%
1 ene 2014 año
46.094
+0.86
1.9%
1 ene 2015 año
46.942
+0.848
1.84%
1 ene 2016 año
47.776
+0.834
1.78%
Ranking de los países por los datos estadísticos actuales


Comentarios: