29
/es/
es
AIzaSyAYiBZKx7MnpbEhh9jyipgxe19OcubqV5w
April 1, 2024
271779
Tuvalu
TUV
true
2
1
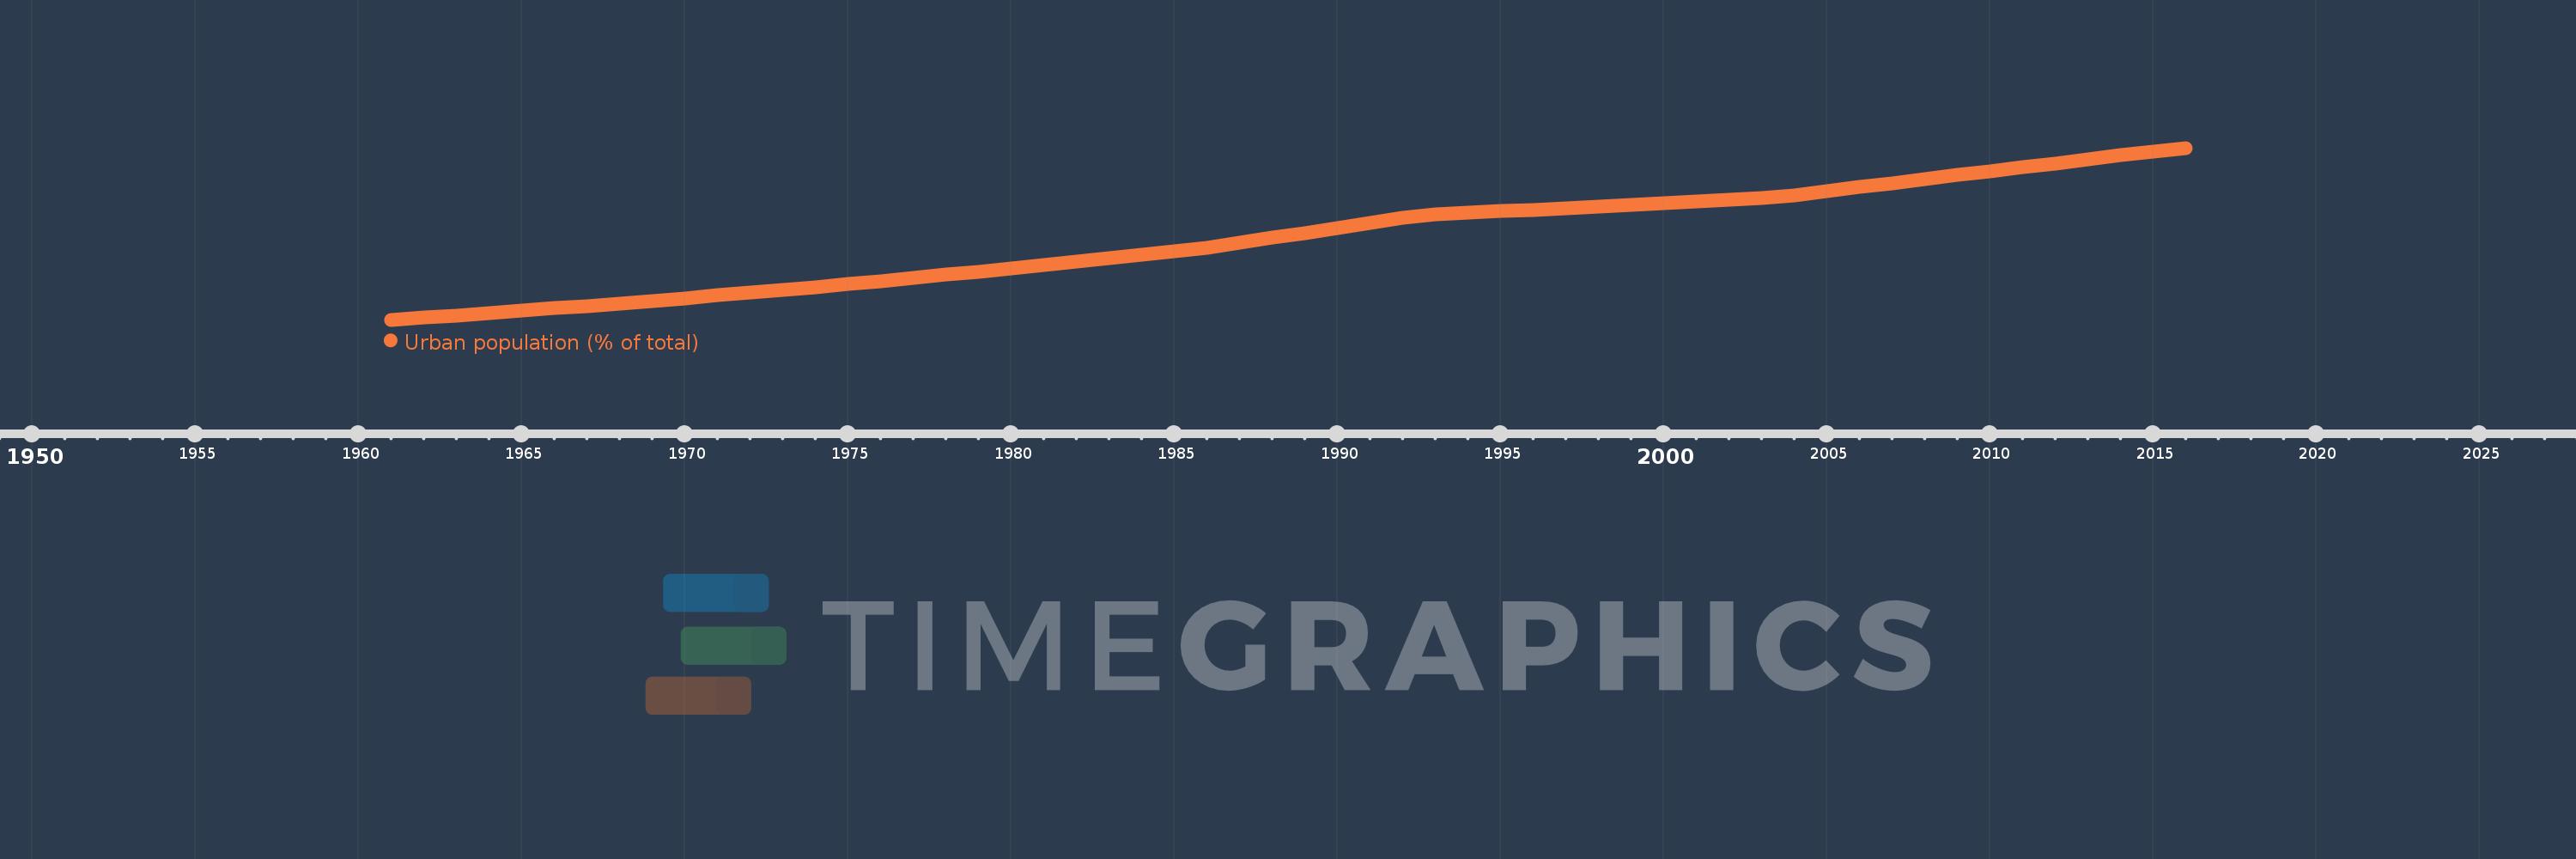
Urban population (% of total)
2016,2015,2014,2013,2012,2011,2010,2009,2008,2007,2006,2005,2004,2003,2002,2001,2000,1999,1998,1997,1996,1995,1994,1993,1992,1991,1990,1989,1988,1987,1986,1985,1984,1983,1982,1981,1980,1979,1978,1977,1976,1975,1974,1973,1972,1971,1970,1969,1968,1967,1966,1965,1964,1963,1962,1961
Estas estadísticas en otros países:
AfghanistanAlbaniaAlgeriaAmerican SamoaAndorraAngolaAntigua and BarbudaArab WorldArgentinaArmeniaArubaAustraliaAustriaAzerbaijanBahamas, TheBahrainBangladeshBarbadosBelarusBelgiumBelizeBeninBermudaBhutanBoliviaBosnia and HerzegovinaBotswanaBrazilBritish Virgin IslandsBrunei DarussalamBulgariaBurkina FasoBurundiCabo VerdeCambodiaCameroonCanadaCaribbean small statesCayman IslandsCentral African RepublicCentral Europe and the BalticsChadChannel IslandsChileChinaColombiaComorosCongo, Dem. Rep.Congo, Rep.Costa RicaCote d'IvoireCroatiaCubaCuracaoCyprusCzech RepublicDenmarkDjiboutiDominicaDominican RepublicEarly-demographic dividendEast Asia & PacificEast Asia & Pacific (excluding high income)East Asia & Pacific (IDA & IBRD countries)EcuadorEgypt, Arab Rep.El SalvadorEquatorial GuineaEritreaEstoniaEthiopiaEuro areaEurope & Central AsiaEurope & Central Asia (excluding high income)Europe & Central Asia (IDA & IBRD countries)European UnionFaroe IslandsFijiFinlandFragile and conflict affected situationsFranceFrench PolynesiaGabonGambia, TheGeorgiaGermanyGhanaGibraltarGreeceGreenlandGrenadaGuamGuatemalaGuineaGuinea-BissauGuyanaHaitiHeavily indebted poor countries (HIPC)High incomeHondurasHong Kong SAR, ChinaHungaryIBRD onlyIcelandIDA & IBRD totalIDA blendIDA onlyIDA totalIndiaIndonesiaIran, Islamic Rep.IraqIrelandIsle of ManIsraelItalyJamaicaJapanJordanKazakhstanKenyaKiribatiKorea, Dem. People’s Rep.Korea, Rep.KuwaitKyrgyz RepublicLao PDRLate-demographic dividendLatin America & Caribbean Latin America & Caribbean (excluding high income)Latin America & the Caribbean (IDA & IBRD countries)LatviaLeast developed countries: UN classificationLebanonLesothoLiberiaLibyaLiechtensteinLithuaniaLow & middle incomeLow incomeLower middle incomeLuxembourgMacao SAR, ChinaMacedonia, FYRMadagascarMalawiMalaysiaMaldivesMaliMaltaMarshall IslandsMauritaniaMauritiusMexicoMicronesia, Fed. Sts.Middle East & North AfricaMiddle East & North Africa (excluding high income)Middle East & North Africa (IDA & IBRD countries)Middle incomeMoldovaMonacoMongoliaMontenegroMoroccoMozambiqueMyanmarNamibiaNauruNepalNetherlandsNew CaledoniaNew ZealandNicaraguaNigerNigeriaNorth AmericaNorthern Mariana IslandsNorwayOECD membersOmanOther small statesPacific island small statesPakistanPalauPanamaPapua New GuineaParaguayPeruPhilippinesPolandPortugalPost-demographic dividendPre-demographic dividendPuerto RicoQatarRomaniaRussian FederationRwandaSamoaSan MarinoSao Tome and PrincipeSaudi ArabiaSenegalSerbiaSeychellesSierra LeoneSingaporeSint Maarten (Dutch part)Slovak RepublicSloveniaSmall statesSolomon IslandsSomaliaSouth AfricaSouth AsiaSouth Asia (IDA & IBRD)South SudanSpainSri LankaSt. Kitts and NevisSt. LuciaSt. Vincent and the GrenadinesSub-Saharan Africa Sub-Saharan Africa (excluding high income)Sub-Saharan Africa (IDA & IBRD countries)SudanSurinameSwazilandSwedenSwitzerlandSyrian Arab RepublicTajikistanTanzaniaThailandTimor-LesteTogoTongaTrinidad and TobagoTunisiaTurkeyTurkmenistanTurks and Caicos IslandsTuvaluUgandaUkraineUnited Arab EmiratesUnited KingdomUnited StatesUpper middle incomeUruguayUzbekistanVanuatuVenezuela, RBVietnamVirgin Islands (U.S.)West Bank and GazaWorldYemen, Rep.ZambiaZimbabwe línea de tiempo (timeline):
En esta escala de tiempo se presenta un gráfico de 1961 y 2016 de Tuvalu. Los datos de 1960 están ausentes. El número de observaciones reales por fecha: 56.
Fuente (nombre):
Indicadores del desarrollo mundial
Fuente (organización):
United Nations, World Urbanization Prospects.
Categorías:
Climate Change, Urban Development
Se ha actualizado:
23 abr 2017 año
Los indicadores de los cambios de valor en los últimos años
Mínimo:
15.895
1 ene 1961 año
Máximo:
59.717
1 ene 2016 año
A la fecha de observación
Valor
Cambio absoluto
El cambio con respecto al valor anterior
1 ene 1961 año
15.895
+15.895
0.0%
1 ene 1962 año
16.444
+0.549
3.45%
1 ene 1963 año
17.008
+0.564
3.43%
1 ene 1964 año
17.587
+0.579
3.4%
1 ene 1965 año
18.183
+0.596
3.39%
1 ene 1966 año
18.793
+0.61
3.35%
1 ene 1967 año
19.419
+0.626
3.33%
1 ene 1968 año
20.061
+0.642
3.31%
1 ene 1969 año
20.719
+0.658
3.28%
1 ene 1970 año
21.392
+0.673
3.25%
1 ene 1971 año
22.081
+0.689
3.22%
1 ene 1972 año
22.786
+0.705
3.19%
1 ene 1973 año
23.507
+0.721
3.16%
1 ene 1974 año
24.242
+0.735
3.13%
1 ene 1975 año
24.994
+0.752
3.1%
1 ene 1976 año
25.761
+0.767
3.07%
1 ene 1977 año
26.545
+0.784
3.04%
1 ene 1978 año
27.341
+0.796
3.0%
1 ene 1979 año
28.153
+0.812
2.97%
1 ene 1980 año
28.98
+0.827
2.94%
1 ene 1981 año
29.822
+0.842
2.91%
1 ene 1982 año
30.675
+0.853
2.86%
1 ene 1983 año
31.544
+0.869
2.83%
1 ene 1984 año
32.425
+0.881
2.79%
1 ene 1985 año
33.32
+0.895
2.76%
1 ene 1986 año
34.251
+0.931
2.79%
1 ene 1987 año
35.496
+1.245
3.63%
1 ene 1988 año
36.762
+1.266
3.57%
1 ene 1989 año
38.047
+1.285
3.5%
1 ene 1990 año
39.346
+1.299
3.41%
1 ene 1991 año
40.661
+1.315
3.34%
1 ene 1992 año
41.991
+1.33
3.27%
1 ene 1993 año
42.751
+0.76
1.81%
1 ene 1994 año
43.156
+0.405
0.95%
1 ene 1995 año
43.563
+0.407
0.94%
1 ene 1996 año
43.97
+0.407
0.93%
1 ene 1997 año
44.379
+0.409
0.93%
1 ene 1998 año
44.787
+0.408
0.92%
1 ene 1999 año
45.197
+0.41
0.92%
1 ene 2000 año
45.607
+0.41
0.91%
1 ene 2001 año
46.018
+0.411
0.9%
1 ene 2002 año
46.429
+0.411
0.89%
1 ene 2003 año
46.841
+0.412
0.89%
1 ene 2004 año
47.656
+0.815
1.74%
1 ene 2005 año
48.678
+1.022
2.14%
1 ene 2006 año
49.699
+1.021
2.1%
1 ene 2007 año
50.721
+1.022
2.06%
1 ene 2008 año
51.743
+1.022
2.01%
1 ene 2009 año
52.765
+1.022
1.98%
1 ene 2010 año
53.782
+1.017
1.93%
1 ene 2011 año
54.796
+1.014
1.89%
1 ene 2012 año
55.807
+1.011
1.85%
1 ene 2013 año
56.815
+1.008
1.81%
1 ene 2014 año
57.814
+0.999
1.76%
1 ene 2015 año
58.782
+0.968
1.67%
1 ene 2016 año
59.717
+0.935
1.59%
Ranking de los países por los datos estadísticos actuales


Comentarios: