29
/es/
es
AIzaSyAYiBZKx7MnpbEhh9jyipgxe19OcubqV5w
April 1, 2024
57013
South Asia
SAS
false
2
1
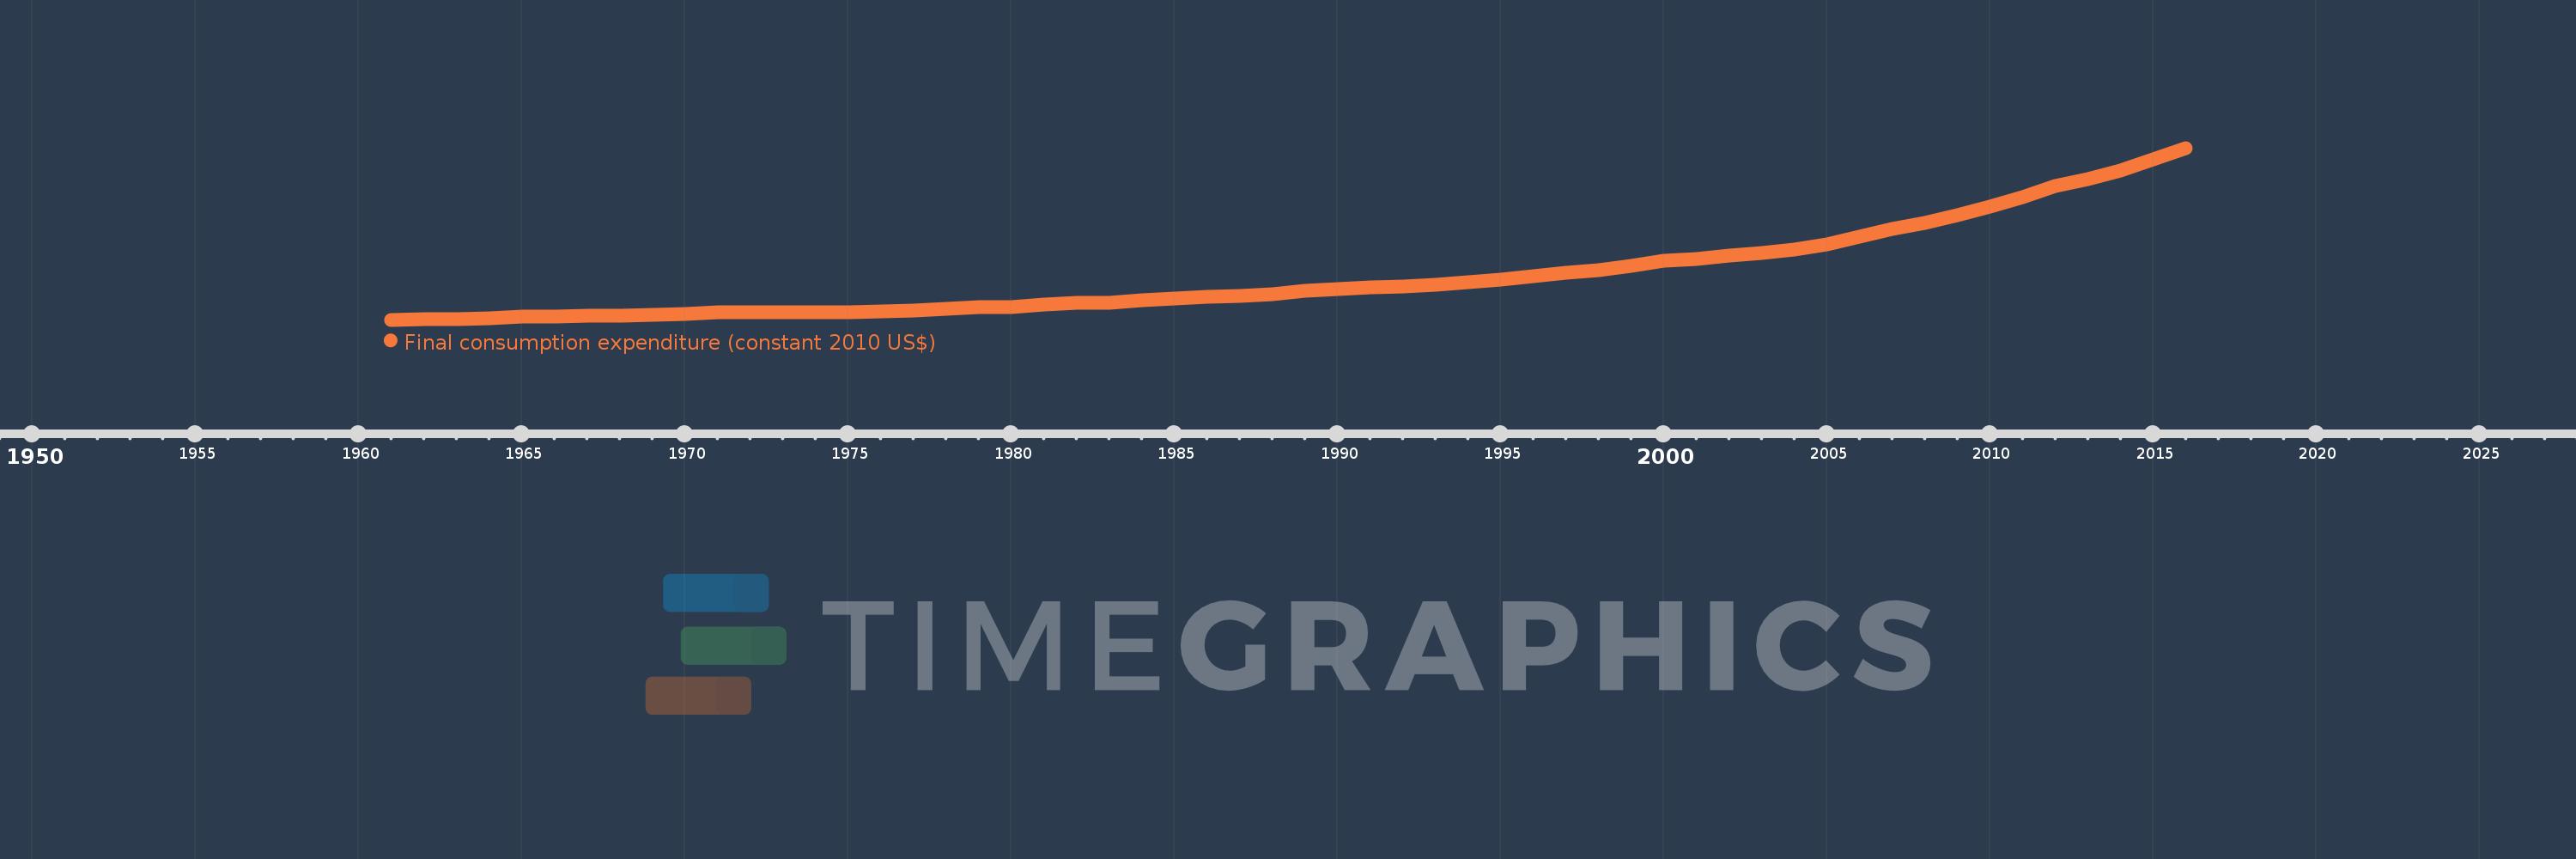
Final consumption expenditure (constant 2010 US$)
2016,2015,2014,2013,2012,2011,2010,2009,2008,2007,2006,2005,2004,2003,2002,2001,2000,1999,1998,1997,1996,1995,1994,1993,1992,1991,1990,1989,1988,1987,1986,1985,1984,1983,1982,1981,1980,1979,1978,1977,1976,1975,1974,1973,1972,1971,1970,1969,1968,1967,1966,1965,1964,1963,1962,1961
Estas estadísticas en otros países:
AfghanistanAlbaniaAlgeriaAngolaAntigua and BarbudaArab WorldArgentinaArmeniaArubaAustraliaAustriaAzerbaijanBahamas, TheBahrainBangladeshBarbadosBelarusBelgiumBelizeBeninBermudaBhutanBoliviaBosnia and HerzegovinaBotswanaBrazilBrunei DarussalamBulgariaBurkina FasoBurundiCabo VerdeCambodiaCameroonCanadaCaribbean small statesCentral African RepublicCentral Europe and the BalticsChadChileChinaColombiaComorosCongo, Dem. Rep.Congo, Rep.Costa RicaCote d'IvoireCroatiaCubaCyprusCzech RepublicDenmarkDominicaDominican RepublicEarly-demographic dividendEast Asia & PacificEast Asia & Pacific (excluding high income)East Asia & Pacific (IDA & IBRD countries)EcuadorEgypt, Arab Rep.El SalvadorEquatorial GuineaEritreaEstoniaEuro areaEurope & Central AsiaEurope & Central Asia (excluding high income)Europe & Central Asia (IDA & IBRD countries)European UnionFaroe IslandsFinlandFranceGabonGambia, TheGeorgiaGermanyGhanaGreeceGrenadaGuatemalaGuineaGuinea-BissauGuyanaHaitiHeavily indebted poor countries (HIPC)High incomeHondurasHong Kong SAR, ChinaHungaryIBRD onlyIcelandIDA & IBRD totalIDA blendIDA onlyIDA totalIndiaIndonesiaIran, Islamic Rep.IrelandIsraelItalyJamaicaJapanJordanKazakhstanKenyaKorea, Rep.KosovoKuwaitKyrgyz RepublicLao PDRLate-demographic dividendLatin America & Caribbean Latin America & Caribbean (excluding high income)Latin America & the Caribbean (IDA & IBRD countries)LatviaLeast developed countries: UN classificationLebanonLiberiaLithuaniaLow & middle incomeLow incomeLower middle incomeLuxembourgMacao SAR, ChinaMacedonia, FYRMadagascarMalawiMalaysiaMaliMaltaMauritaniaMauritiusMexicoMiddle East & North AfricaMiddle East & North Africa (excluding high income)Middle East & North Africa (IDA & IBRD countries)Middle incomeMoldovaMongoliaMontenegroMoroccoMozambiqueNamibiaNepalNetherlandsNew ZealandNicaraguaNigerNigeriaNorth AmericaNorwayOECD membersOmanOther small statesPakistanPanamaParaguayPeruPhilippinesPolandPortugalPost-demographic dividendPre-demographic dividendPuerto RicoQatarRomaniaRussian FederationRwandaSaudi ArabiaSenegalSerbiaSeychellesSierra LeoneSingaporeSlovak RepublicSloveniaSmall statesSouth AfricaSouth AsiaSouth Asia (IDA & IBRD)South SudanSpainSri LankaSt. Kitts and NevisSt. LuciaSt. Vincent and the GrenadinesSub-Saharan Africa Sub-Saharan Africa (excluding high income)Sub-Saharan Africa (IDA & IBRD countries)SudanSurinameSwazilandSwedenSwitzerlandTajikistanTanzaniaThailandTimor-LesteTogoTongaTrinidad and TobagoTunisiaTurkeyUgandaUkraineUnited Arab EmiratesUnited KingdomUnited StatesUpper middle incomeUruguayUzbekistanVanuatuVenezuela, RBVietnamWest Bank and GazaWorldYemen, Rep.ZambiaZimbabwe línea de tiempo (timeline):
En esta escala de tiempo se presenta un gráfico de 1961 y 2016 de South Asia. Los datos de 1960 están ausentes. El número de observaciones reales por fecha: 56.
Fuente (nombre):
Indicadores del desarrollo mundial
Fuente (organización):
World Bank national accounts data, and OECD National Accounts data files.
Categorías:
Economy & Growth
Se ha actualizado:
23 abr 2017 año
Los indicadores de los cambios de valor en los últimos años
Mínimo:
179.835 bn
1 ene 1961 año
Máximo:
1.93 billones
1 ene 2016 año
A la fecha de observación
Valor
Cambio absoluto
El cambio con respecto al valor anterior
1 ene 1961 año
179.835 bn
+179.835 bn
0.0%
1 ene 1962 año
185.361 bn
+5.527 bn
3.07%
1 ene 1963 año
189.086 bn
+3.725 bn
2.01%
1 ene 1964 año
198.403 bn
+9.316 bn
4.93%
1 ene 1965 año
211.613 bn
+13.21 bn
6.66%
1 ene 1966 año
213.449 bn
+1.837 bn
0.87%
1 ene 1967 año
216.949 bn
+3.5 bn
1.64%
1 ene 1968 año
224.91 bn
+7.961 bn
3.67%
1 ene 1969 año
231.259 bn
+6.349 bn
2.82%
1 ene 1970 año
241.752 bn
+10.493 bn
4.54%
1 ene 1971 año
253.504 bn
+11.752 bn
4.86%
1 ene 1972 año
258.459 bn
+4.955 bn
1.95%
1 ene 1973 año
257.69 bn
-768.327 millones
-0.3%
1 ene 1974 año
257.505 bn
-185.015 millones
-0.07%
1 ene 1975 año
255.267 bn
-2.238 bn
-0.87%
1 ene 1976 año
266.749 bn
+11.482 bn
4.5%
1 ene 1977 año
275.783 bn
+9.034 bn
3.39%
1 ene 1978 año
290.538 bn
+14.755 bn
5.35%
1 ene 1979 año
310.714 bn
+20.176 bn
6.94%
1 ene 1980 año
309.36 bn
-1.354 bn
-0.44%
1 ene 1981 año
333.131 bn
+23.77 bn
7.68%
1 ene 1982 año
348.094 bn
+14.963 bn
4.49%
1 ene 1983 año
353.415 bn
+5.321 bn
1.53%
1 ene 1984 año
377.274 bn
+23.859 bn
6.75%
1 ene 1985 año
392.652 bn
+15.378 bn
4.08%
1 ene 1986 año
411.064 bn
+18.412 bn
4.69%
1 ene 1987 año
426.386 bn
+15.323 bn
3.73%
1 ene 1988 año
443.883 bn
+17.496 bn
4.1%
1 ene 1989 año
471.375 bn
+27.492 bn
6.19%
1 ene 1990 año
492.622 bn
+21.247 bn
4.51%
1 ene 1991 año
512.53 bn
+19.908 bn
4.04%
1 ene 1992 año
519.37 bn
+6.84 bn
1.33%
1 ene 1993 año
539.697 bn
+20.327 bn
3.91%
1 ene 1994 año
564.359 bn
+24.662 bn
4.57%
1 ene 1995 año
586.361 bn
+22.003 bn
3.9%
1 ene 1996 año
621.978 bn
+35.617 bn
6.07%
1 ene 1997 año
662.325 bn
+40.346 bn
6.49%
1 ene 1998 año
687.619 bn
+25.294 bn
3.82%
1 ene 1999 año
730.193 bn
+42.575 bn
6.19%
1 ene 2000 año
777.946 bn
+47.753 bn
6.54%
1 ene 2001 año
801.302 bn
+23.356 bn
3.0%
1 ene 2002 año
835.893 bn
+34.59 bn
4.32%
1 ene 2003 año
856.802 bn
+20.909 bn
2.5%
1 ene 2004 año
898.321 bn
+41.519 bn
4.85%
1 ene 2005 año
947.913 bn
+49.593 bn
5.52%
1 ene 2006 año
1.03 billones
+82.134 bn
8.66%
1 ene 2007 año
1.106 billones
+76.045 bn
7.38%
1 ene 2008 año
1.168 billones
+61.421 bn
5.55%
1 ene 2009 año
1.246 billones
+78.659 bn
6.74%
1 ene 2010 año
1.331 billones
+85.216 bn
6.84%
1 ene 2011 año
1.427 billones
+95.828 bn
7.2%
1 ene 2012 año
1.543 billones
+115.468 bn
8.09%
1 ene 2013 año
1.614 billones
+71.078 bn
4.61%
1 ene 2014 año
1.702 billones
+87.834 bn
5.44%
1 ene 2015 año
1.816 billones
+114.406 bn
6.72%
1 ene 2016 año
1.93 billones
+113.643 bn
6.26%
Ranking de los países por los datos estadísticos actuales


Comentarios: