29
/es/
es
AIzaSyAYiBZKx7MnpbEhh9jyipgxe19OcubqV5w
April 1, 2024
209277
New Zealand
NZL
true
2
1
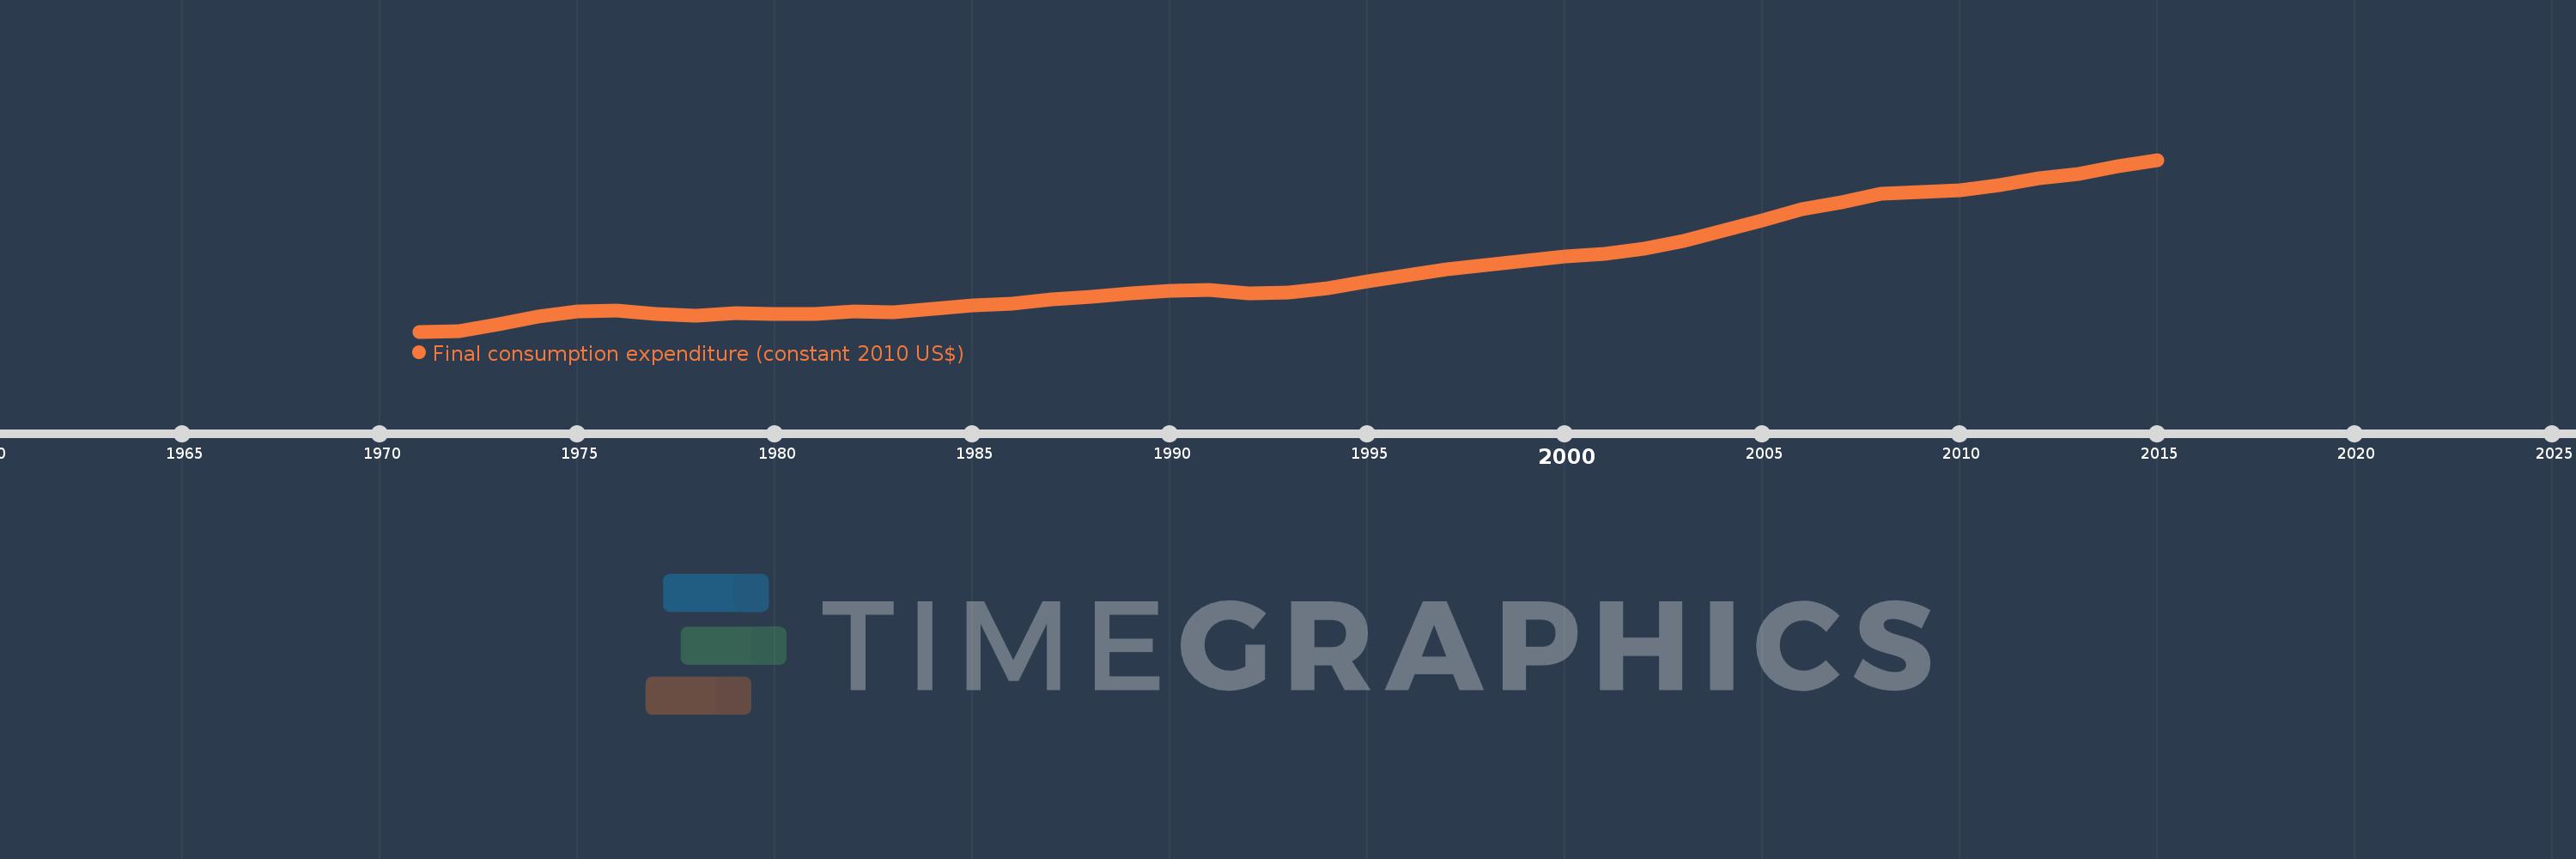
Final consumption expenditure (constant 2010 US$)
2015,2014,2013,2012,2011,2010,2009,2008,2007,2006,2005,2004,2003,2002,2001,2000,1999,1998,1997,1996,1995,1994,1993,1992,1991,1990,1989,1988,1987,1986,1985,1984,1983,1982,1981,1980,1979,1978,1977,1976,1975,1974,1973,1972,1971
Estas estadísticas en otros países:
AfghanistanAlbaniaAlgeriaAngolaAntigua and BarbudaArab WorldArgentinaArmeniaArubaAustraliaAustriaAzerbaijanBahamas, TheBahrainBangladeshBarbadosBelarusBelgiumBelizeBeninBermudaBhutanBoliviaBosnia and HerzegovinaBotswanaBrazilBrunei DarussalamBulgariaBurkina FasoBurundiCabo VerdeCambodiaCameroonCanadaCaribbean small statesCentral African RepublicCentral Europe and the BalticsChadChileChinaColombiaComorosCongo, Dem. Rep.Congo, Rep.Costa RicaCote d'IvoireCroatiaCubaCyprusCzech RepublicDenmarkDominicaDominican RepublicEarly-demographic dividendEast Asia & PacificEast Asia & Pacific (excluding high income)East Asia & Pacific (IDA & IBRD countries)EcuadorEgypt, Arab Rep.El SalvadorEquatorial GuineaEritreaEstoniaEuro areaEurope & Central AsiaEurope & Central Asia (excluding high income)Europe & Central Asia (IDA & IBRD countries)European UnionFaroe IslandsFinlandFranceGabonGambia, TheGeorgiaGermanyGhanaGreeceGrenadaGuatemalaGuineaGuinea-BissauGuyanaHaitiHeavily indebted poor countries (HIPC)High incomeHondurasHong Kong SAR, ChinaHungaryIBRD onlyIcelandIDA & IBRD totalIDA blendIDA onlyIDA totalIndiaIndonesiaIran, Islamic Rep.IrelandIsraelItalyJamaicaJapanJordanKazakhstanKenyaKorea, Rep.KosovoKuwaitKyrgyz RepublicLao PDRLate-demographic dividendLatin America & Caribbean Latin America & Caribbean (excluding high income)Latin America & the Caribbean (IDA & IBRD countries)LatviaLeast developed countries: UN classificationLebanonLiberiaLithuaniaLow & middle incomeLow incomeLower middle incomeLuxembourgMacao SAR, ChinaMacedonia, FYRMadagascarMalawiMalaysiaMaliMaltaMauritaniaMauritiusMexicoMiddle East & North AfricaMiddle East & North Africa (excluding high income)Middle East & North Africa (IDA & IBRD countries)Middle incomeMoldovaMongoliaMontenegroMoroccoMozambiqueNamibiaNepalNetherlandsNew ZealandNicaraguaNigerNigeriaNorth AmericaNorwayOECD membersOmanOther small statesPakistanPanamaParaguayPeruPhilippinesPolandPortugalPost-demographic dividendPre-demographic dividendPuerto RicoQatarRomaniaRussian FederationRwandaSaudi ArabiaSenegalSerbiaSeychellesSierra LeoneSingaporeSlovak RepublicSloveniaSmall statesSouth AfricaSouth AsiaSouth Asia (IDA & IBRD)South SudanSpainSri LankaSt. Kitts and NevisSt. LuciaSt. Vincent and the GrenadinesSub-Saharan Africa Sub-Saharan Africa (excluding high income)Sub-Saharan Africa (IDA & IBRD countries)SudanSurinameSwazilandSwedenSwitzerlandTajikistanTanzaniaThailandTimor-LesteTogoTongaTrinidad and TobagoTunisiaTurkeyUgandaUkraineUnited Arab EmiratesUnited KingdomUnited StatesUpper middle incomeUruguayUzbekistanVanuatuVenezuela, RBVietnamWest Bank and GazaWorldYemen, Rep.ZambiaZimbabwe línea de tiempo (timeline):
En esta escala de tiempo se presenta un gráfico de 1971 y 2015 de New Zealand. Los datos de 1970 están ausentes. El número de observaciones reales por fecha: 45.
Fuente (nombre):
Indicadores del desarrollo mundial
Fuente (organización):
World Bank national accounts data, and OECD National Accounts data files.
Categorías:
Economy & Growth
Se ha actualizado:
23 abr 2017 año
Los indicadores de los cambios de valor en los últimos años
Mínimo:
44.502 bn
1 ene 1971 año
Máximo:
125.711 bn
1 ene 2015 año
A la fecha de observación
Valor
Cambio absoluto
El cambio con respecto al valor anterior
1 ene 1971 año
44.502 bn
+44.502 bn
0.0%
1 ene 1972 año
44.883 bn
+380.796 millones
0.86%
1 ene 1973 año
47.958 bn
+3.075 bn
6.85%
1 ene 1974 año
51.566 bn
+3.608 bn
7.52%
1 ene 1975 año
54.082 bn
+2.516 bn
4.88%
1 ene 1976 año
54.322 bn
+240.635 millones
0.44%
1 ene 1977 año
52.843 bn
-1.479 bn
-2.72%
1 ene 1978 año
51.994 bn
-848.843 millones
-1.61%
1 ene 1979 año
53.277 bn
+1.283 bn
2.47%
1 ene 1980 año
52.917 bn
-360.839 millones
-0.68%
1 ene 1981 año
52.938 bn
+21.142 millones
0.04%
1 ene 1982 año
53.993 bn
+1.055 bn
1.99%
1 ene 1983 año
53.501 bn
-491.089 millones
-0.91%
1 ene 1984 año
55.102 bn
+1.601 bn
2.99%
1 ene 1985 año
56.948 bn
+1.846 bn
3.35%
1 ene 1986 año
57.761 bn
+812.548 millones
1.43%
1 ene 1987 año
59.633 bn
+1.872 bn
3.24%
1 ene 1988 año
61.05 bn
+1.416 bn
2.38%
1 ene 1989 año
62.419 bn
+1.369 bn
2.24%
1 ene 1990 año
63.672 bn
+1.253 bn
2.01%
1 ene 1991 año
64.028 bn
+356.191 millones
0.56%
1 ene 1992 año
62.713 bn
-1.315 bn
-2.05%
1 ene 1993 año
63.035 bn
+321.674 millones
0.51%
1 ene 1994 año
65.118 bn
+2.084 bn
3.31%
1 ene 1995 año
68.273 bn
+3.154 bn
4.84%
1 ene 1996 año
71.037 bn
+2.764 bn
4.05%
1 ene 1997 año
74.002 bn
+2.965 bn
4.17%
1 ene 1998 año
76.075 bn
+2.073 bn
2.8%
1 ene 1999 año
78.078 bn
+2.003 bn
2.63%
1 ene 2000 año
80.224 bn
+2.146 bn
2.75%
1 ene 2001 año
81.267 bn
+1.043 bn
1.3%
1 ene 2002 año
83.669 bn
+2.402 bn
2.96%
1 ene 2003 año
87.204 bn
+3.535 bn
4.23%
1 ene 2004 año
92.319 bn
+5.114 bn
5.86%
1 ene 2005 año
97.148 bn
+4.83 bn
5.23%
1 ene 2006 año
102.198 bn
+5.05 bn
5.2%
1 ene 2007 año
105.514 bn
+3.316 bn
3.24%
1 ene 2008 año
109.813 bn
+4.299 bn
4.07%
1 ene 2009 año
110.289 bn
+475.167 millones
0.43%
1 ene 2010 año
111.304 bn
+1.015 bn
0.92%
1 ene 2011 año
113.786 bn
+2.482 bn
2.23%
1 ene 2012 año
117.063 bn
+3.277 bn
2.88%
1 ene 2013 año
119.148 bn
+2.085 bn
1.78%
1 ene 2014 año
122.575 bn
+3.427 bn
2.88%
1 ene 2015 año
125.711 bn
+3.137 bn
2.56%
Ranking de los países por los datos estadísticos actuales


Comentarios: