29
/es/
es
AIzaSyAYiBZKx7MnpbEhh9jyipgxe19OcubqV5w
April 1, 2024
152482
Hungary
HUN
true
2
1
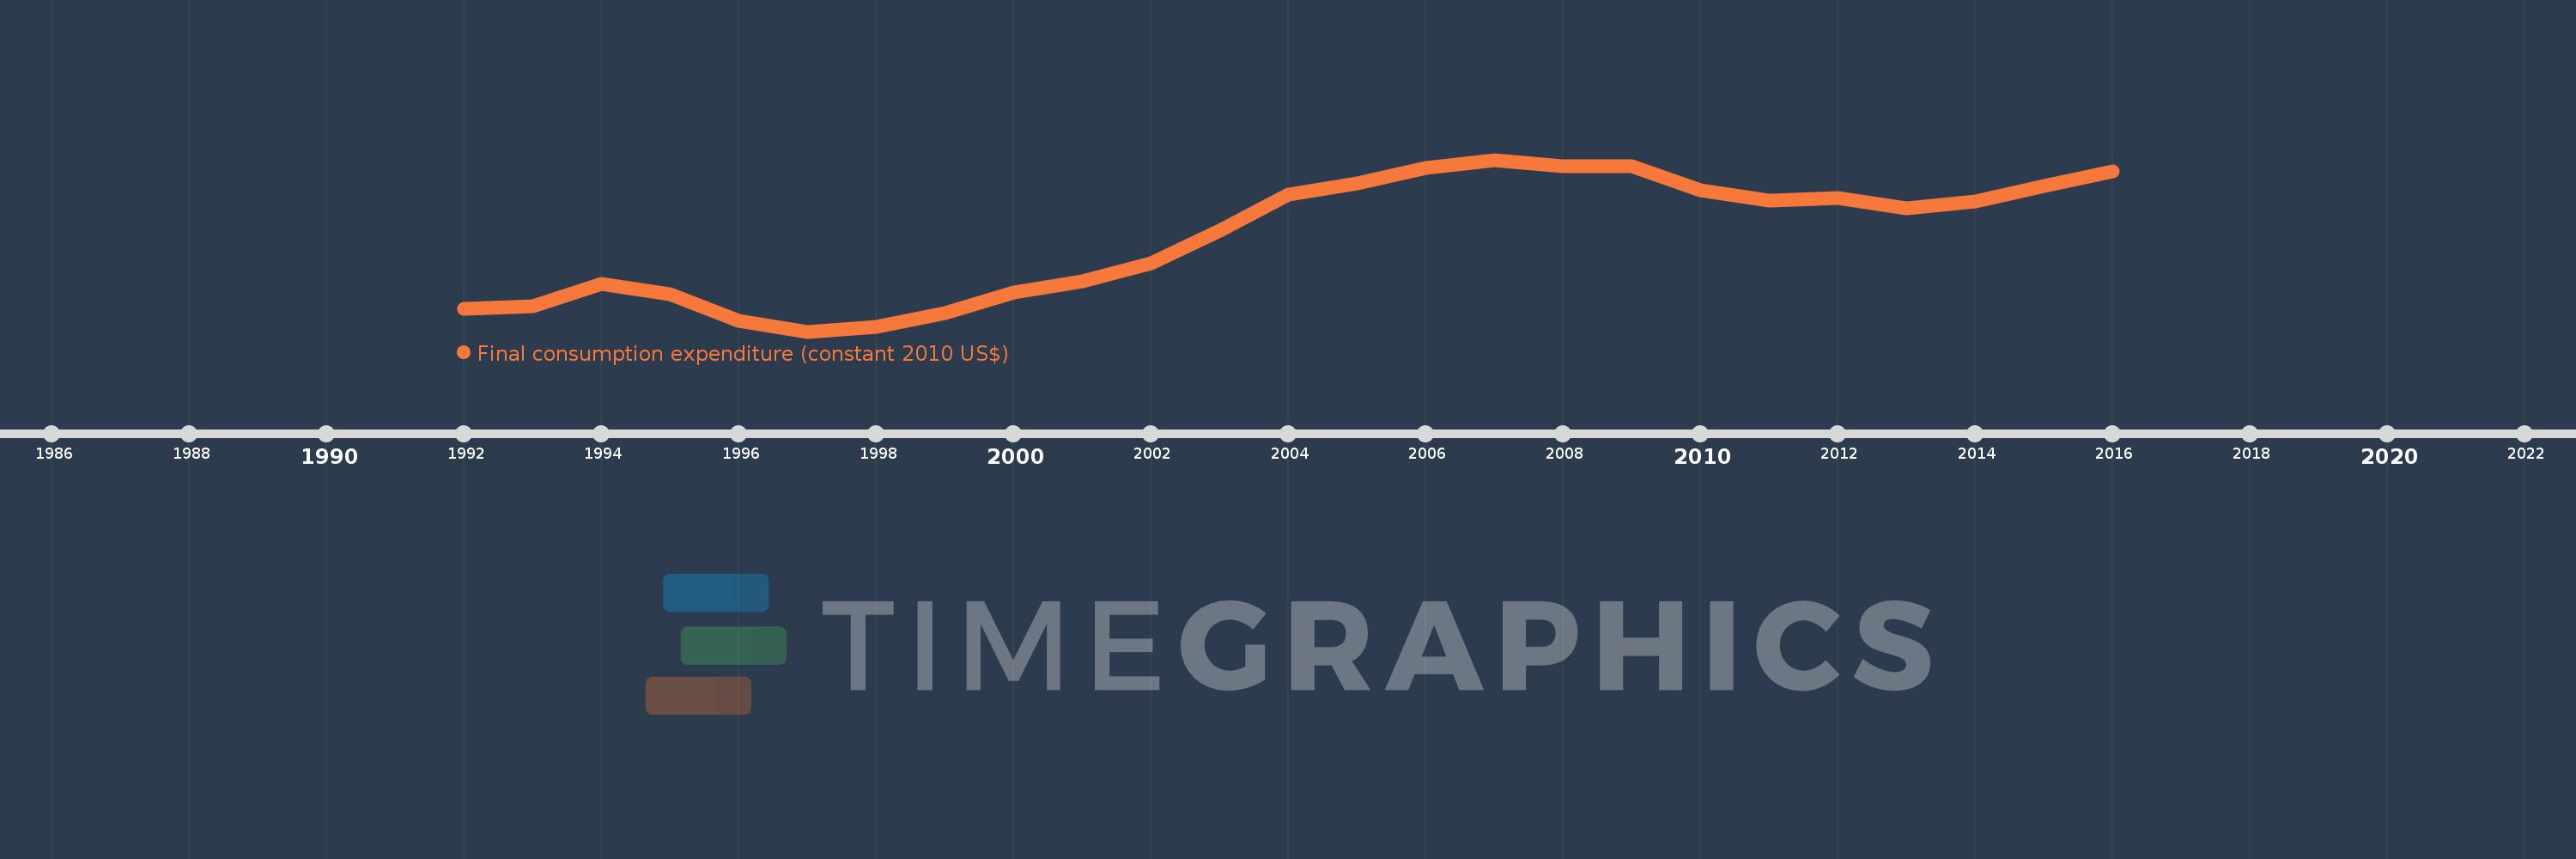
Final consumption expenditure (constant 2010 US$)
2016,2015,2014,2013,2012,2011,2010,2009,2008,2007,2006,2005,2004,2003,2002,2001,2000,1999,1998,1997,1996,1995,1994,1993,1992
Estas estadísticas en otros países:
AfghanistanAlbaniaAlgeriaAngolaAntigua and BarbudaArab WorldArgentinaArmeniaArubaAustraliaAustriaAzerbaijanBahamas, TheBahrainBangladeshBarbadosBelarusBelgiumBelizeBeninBermudaBhutanBoliviaBosnia and HerzegovinaBotswanaBrazilBrunei DarussalamBulgariaBurkina FasoBurundiCabo VerdeCambodiaCameroonCanadaCaribbean small statesCentral African RepublicCentral Europe and the BalticsChadChileChinaColombiaComorosCongo, Dem. Rep.Congo, Rep.Costa RicaCote d'IvoireCroatiaCubaCyprusCzech RepublicDenmarkDominicaDominican RepublicEarly-demographic dividendEast Asia & PacificEast Asia & Pacific (excluding high income)East Asia & Pacific (IDA & IBRD countries)EcuadorEgypt, Arab Rep.El SalvadorEquatorial GuineaEritreaEstoniaEuro areaEurope & Central AsiaEurope & Central Asia (excluding high income)Europe & Central Asia (IDA & IBRD countries)European UnionFaroe IslandsFinlandFranceGabonGambia, TheGeorgiaGermanyGhanaGreeceGrenadaGuatemalaGuineaGuinea-BissauGuyanaHaitiHeavily indebted poor countries (HIPC)High incomeHondurasHong Kong SAR, ChinaHungaryIBRD onlyIcelandIDA & IBRD totalIDA blendIDA onlyIDA totalIndiaIndonesiaIran, Islamic Rep.IrelandIsraelItalyJamaicaJapanJordanKazakhstanKenyaKorea, Rep.KosovoKuwaitKyrgyz RepublicLao PDRLate-demographic dividendLatin America & Caribbean Latin America & Caribbean (excluding high income)Latin America & the Caribbean (IDA & IBRD countries)LatviaLeast developed countries: UN classificationLebanonLiberiaLithuaniaLow & middle incomeLow incomeLower middle incomeLuxembourgMacao SAR, ChinaMacedonia, FYRMadagascarMalawiMalaysiaMaliMaltaMauritaniaMauritiusMexicoMiddle East & North AfricaMiddle East & North Africa (excluding high income)Middle East & North Africa (IDA & IBRD countries)Middle incomeMoldovaMongoliaMontenegroMoroccoMozambiqueNamibiaNepalNetherlandsNew ZealandNicaraguaNigerNigeriaNorth AmericaNorwayOECD membersOmanOther small statesPakistanPanamaParaguayPeruPhilippinesPolandPortugalPost-demographic dividendPre-demographic dividendPuerto RicoQatarRomaniaRussian FederationRwandaSaudi ArabiaSenegalSerbiaSeychellesSierra LeoneSingaporeSlovak RepublicSloveniaSmall statesSouth AfricaSouth AsiaSouth Asia (IDA & IBRD)South SudanSpainSri LankaSt. Kitts and NevisSt. LuciaSt. Vincent and the GrenadinesSub-Saharan Africa Sub-Saharan Africa (excluding high income)Sub-Saharan Africa (IDA & IBRD countries)SudanSurinameSwazilandSwedenSwitzerlandTajikistanTanzaniaThailandTimor-LesteTogoTongaTrinidad and TobagoTunisiaTurkeyUgandaUkraineUnited Arab EmiratesUnited KingdomUnited StatesUpper middle incomeUruguayUzbekistanVanuatuVenezuela, RBVietnamWest Bank and GazaWorldYemen, Rep.ZambiaZimbabwe línea de tiempo (timeline):
En esta escala de tiempo se presenta un gráfico de 1992 y 2016 de Hungary. Los datos de 1991 están ausentes. El número de observaciones reales por fecha: 25.
Fuente (nombre):
Indicadores del desarrollo mundial
Fuente (organización):
World Bank national accounts data, and OECD National Accounts data files.
Categorías:
Economy & Growth
Se ha actualizado:
23 abr 2017 año
Los indicadores de los cambios de valor en los últimos años
Mínimo:
71.883 bn
1 ene 1997 año
Máximo:
104.05 bn
1 ene 2007 año
A la fecha de observación
Valor
Cambio absoluto
El cambio con respecto al valor anterior
1 ene 1992 año
76.17 bn
+76.17 bn
0.0%
1 ene 1993 año
76.637 bn
+467.913 millones
0.61%
1 ene 1994 año
80.808 bn
+4.171 bn
5.44%
1 ene 1995 año
78.96 bn
-1.848 bn
-2.29%
1 ene 1996 año
73.823 bn
-5.137 bn
-6.51%
1 ene 1997 año
71.883 bn
-1.94 bn
-2.63%
1 ene 1998 año
72.737 bn
+853.948 millones
1.19%
1 ene 1999 año
75.264 bn
+2.527 bn
3.47%
1 ene 2000 año
79.182 bn
+3.917 bn
5.2%
1 ene 2001 año
81.306 bn
+2.125 bn
2.68%
1 ene 2002 año
84.735 bn
+3.429 bn
4.22%
1 ene 2003 año
90.821 bn
+6.086 bn
7.18%
1 ene 2004 año
97.514 bn
+6.693 bn
7.37%
1 ene 2005 año
99.582 bn
+2.067 bn
2.12%
1 ene 2006 año
102.531 bn
+2.949 bn
2.96%
1 ene 2007 año
104.05 bn
+1.519 bn
1.48%
1 ene 2008 año
102.806 bn
-1.244 bn
-1.2%
1 ene 2009 año
102.844 bn
+37.57 millones
0.04%
1 ene 2010 año
98.367 bn
-4.477 bn
-4.35%
1 ene 2011 año
96.33 bn
-2.036 bn
-2.07%
1 ene 2012 año
96.898 bn
+568.019 millones
0.59%
1 ene 2013 año
95.011 bn
-1.888 bn
-1.95%
1 ene 2014 año
96.252 bn
+1.242 bn
1.31%
1 ene 2015 año
99.179 bn
+2.926 bn
3.04%
1 ene 2016 año
101.872 bn
+2.693 bn
2.72%
Ranking de los países por los datos estadísticos actuales


Comentarios: