29
/es/
es
AIzaSyAYiBZKx7MnpbEhh9jyipgxe19OcubqV5w
April 1, 2024
224801
Poland
POL
true
2
1
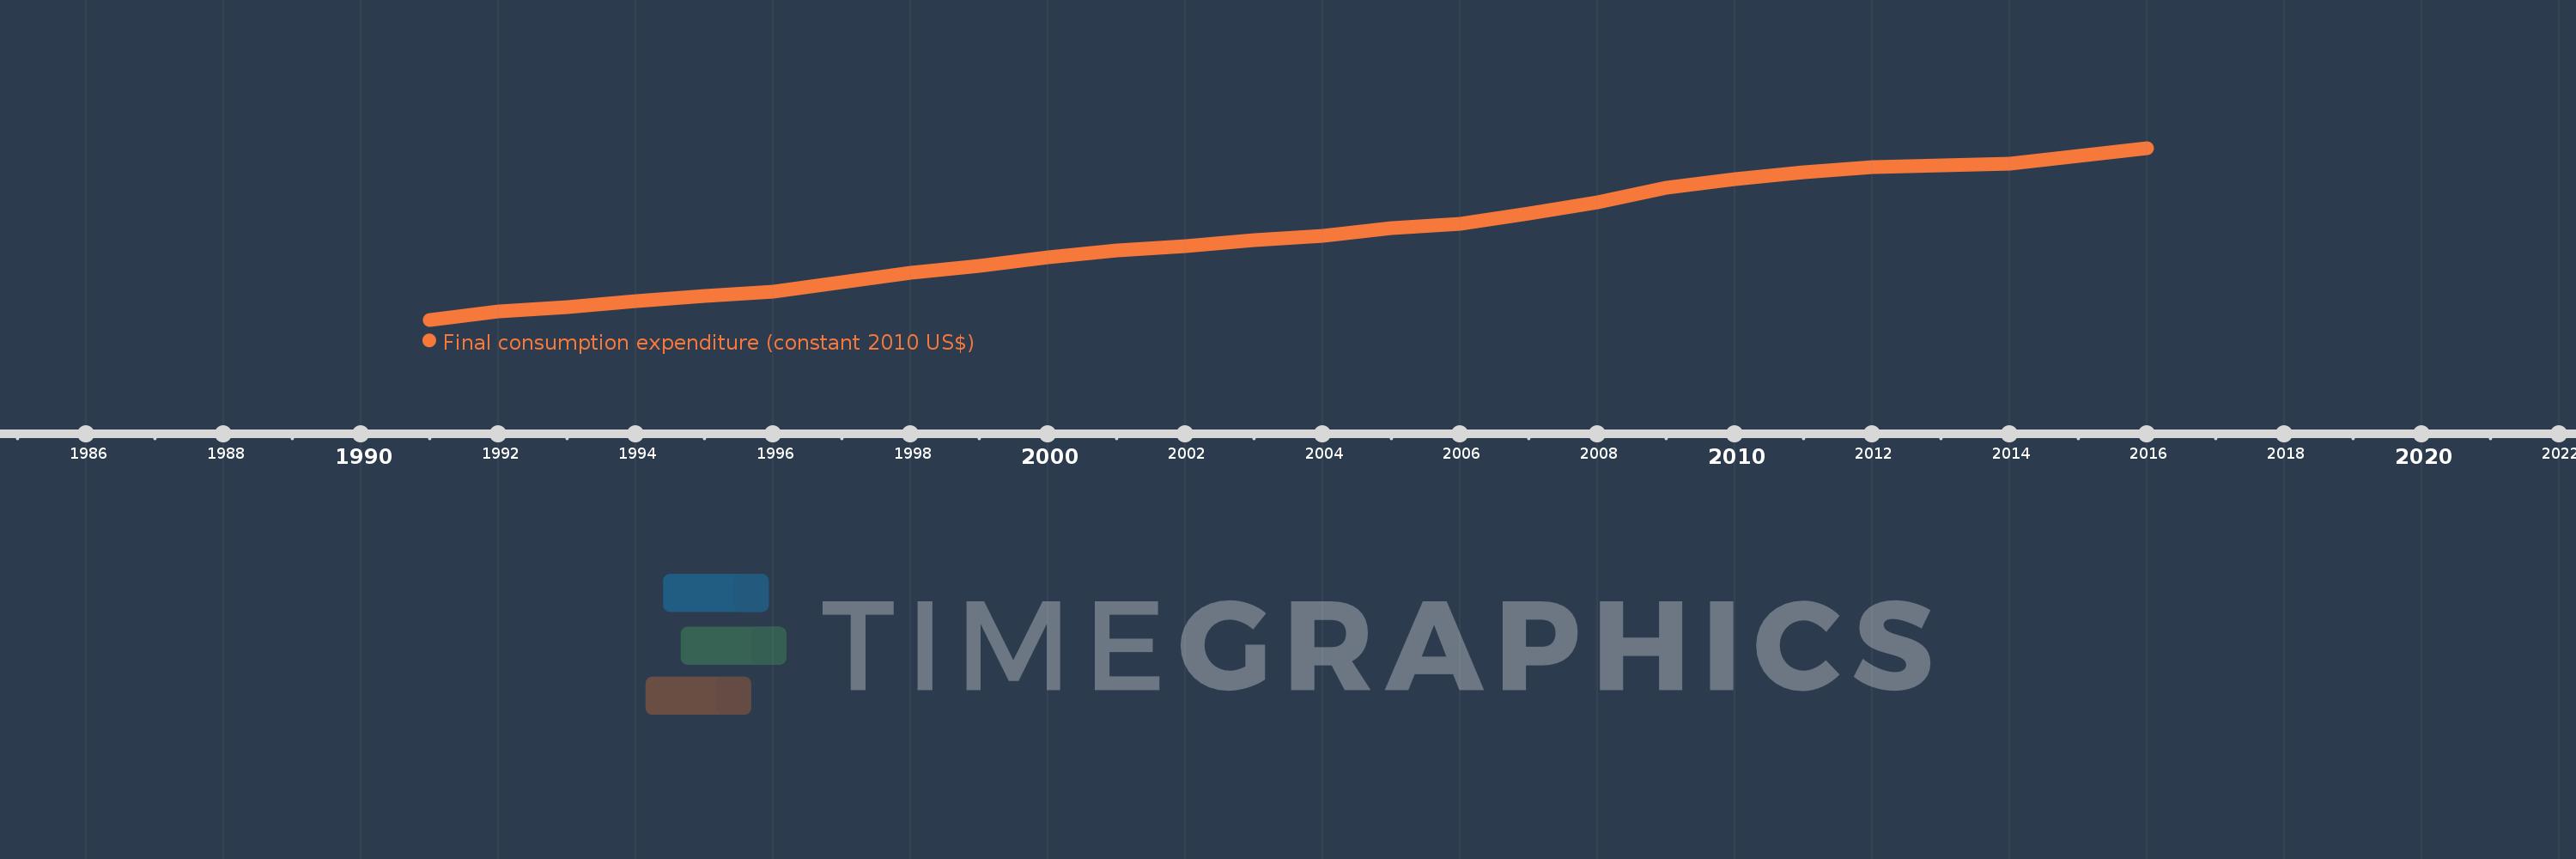
Final consumption expenditure (constant 2010 US$)
2016,2015,2014,2013,2012,2011,2010,2009,2008,2007,2006,2005,2004,2003,2002,2001,2000,1999,1998,1997,1996,1995,1994,1993,1992,1991
Estas estadísticas en otros países:
AfghanistanAlbaniaAlgeriaAngolaAntigua and BarbudaArab WorldArgentinaArmeniaArubaAustraliaAustriaAzerbaijanBahamas, TheBahrainBangladeshBarbadosBelarusBelgiumBelizeBeninBermudaBhutanBoliviaBosnia and HerzegovinaBotswanaBrazilBrunei DarussalamBulgariaBurkina FasoBurundiCabo VerdeCambodiaCameroonCanadaCaribbean small statesCentral African RepublicCentral Europe and the BalticsChadChileChinaColombiaComorosCongo, Dem. Rep.Congo, Rep.Costa RicaCote d'IvoireCroatiaCubaCyprusCzech RepublicDenmarkDominicaDominican RepublicEarly-demographic dividendEast Asia & PacificEast Asia & Pacific (excluding high income)East Asia & Pacific (IDA & IBRD countries)EcuadorEgypt, Arab Rep.El SalvadorEquatorial GuineaEritreaEstoniaEuro areaEurope & Central AsiaEurope & Central Asia (excluding high income)Europe & Central Asia (IDA & IBRD countries)European UnionFaroe IslandsFinlandFranceGabonGambia, TheGeorgiaGermanyGhanaGreeceGrenadaGuatemalaGuineaGuinea-BissauGuyanaHaitiHeavily indebted poor countries (HIPC)High incomeHondurasHong Kong SAR, ChinaHungaryIBRD onlyIcelandIDA & IBRD totalIDA blendIDA onlyIDA totalIndiaIndonesiaIran, Islamic Rep.IrelandIsraelItalyJamaicaJapanJordanKazakhstanKenyaKorea, Rep.KosovoKuwaitKyrgyz RepublicLao PDRLate-demographic dividendLatin America & Caribbean Latin America & Caribbean (excluding high income)Latin America & the Caribbean (IDA & IBRD countries)LatviaLeast developed countries: UN classificationLebanonLiberiaLithuaniaLow & middle incomeLow incomeLower middle incomeLuxembourgMacao SAR, ChinaMacedonia, FYRMadagascarMalawiMalaysiaMaliMaltaMauritaniaMauritiusMexicoMiddle East & North AfricaMiddle East & North Africa (excluding high income)Middle East & North Africa (IDA & IBRD countries)Middle incomeMoldovaMongoliaMontenegroMoroccoMozambiqueNamibiaNepalNetherlandsNew ZealandNicaraguaNigerNigeriaNorth AmericaNorwayOECD membersOmanOther small statesPakistanPanamaParaguayPeruPhilippinesPolandPortugalPost-demographic dividendPre-demographic dividendPuerto RicoQatarRomaniaRussian FederationRwandaSaudi ArabiaSenegalSerbiaSeychellesSierra LeoneSingaporeSlovak RepublicSloveniaSmall statesSouth AfricaSouth AsiaSouth Asia (IDA & IBRD)South SudanSpainSri LankaSt. Kitts and NevisSt. LuciaSt. Vincent and the GrenadinesSub-Saharan Africa Sub-Saharan Africa (excluding high income)Sub-Saharan Africa (IDA & IBRD countries)SudanSurinameSwazilandSwedenSwitzerlandTajikistanTanzaniaThailandTimor-LesteTogoTongaTrinidad and TobagoTunisiaTurkeyUgandaUkraineUnited Arab EmiratesUnited KingdomUnited StatesUpper middle incomeUruguayUzbekistanVanuatuVenezuela, RBVietnamWest Bank and GazaWorldYemen, Rep.ZambiaZimbabwe línea de tiempo (timeline):
En esta escala de tiempo se presenta un gráfico de 1991 y 2016 de Poland. Los datos de 1990 están ausentes. El número de observaciones reales por fecha: 26.
Fuente (nombre):
Indicadores del desarrollo mundial
Fuente (organización):
World Bank national accounts data, and OECD National Accounts data files.
Categorías:
Economy & Growth
Se ha actualizado:
23 abr 2017 año
Los indicadores de los cambios de valor en los últimos años
Mínimo:
166.251 bn
1 ene 1991 año
Máximo:
422.997 bn
1 ene 2016 año
A la fecha de observación
Valor
Cambio absoluto
El cambio con respecto al valor anterior
1 ene 1991 año
166.251 bn
+166.251 bn
0.0%
1 ene 1992 año
178.735 bn
+12.484 bn
7.51%
1 ene 1993 año
185.185 bn
+6.45 bn
3.61%
1 ene 1994 año
193.924 bn
+8.739 bn
4.72%
1 ene 1995 año
201.415 bn
+7.491 bn
3.86%
1 ene 1996 año
208.073 bn
+6.658 bn
3.31%
1 ene 1997 año
222.924 bn
+14.851 bn
7.14%
1 ene 1998 año
236.97 bn
+14.046 bn
6.3%
1 ene 1999 año
246.963 bn
+9.994 bn
4.22%
1 ene 2000 año
259.322 bn
+12.359 bn
5.0%
1 ene 2001 año
269.695 bn
+10.374 bn
4.0%
1 ene 2002 año
276.193 bn
+6.498 bn
2.41%
1 ene 2003 año
285.866 bn
+9.673 bn
3.5%
1 ene 2004 año
291.585 bn
+5.719 bn
2.0%
1 ene 2005 año
303.684 bn
+12.099 bn
4.15%
1 ene 2006 año
310.213 bn
+6.529 bn
2.15%
1 ene 2007 año
325.558 bn
+15.346 bn
4.95%
1 ene 2008 año
341.944 bn
+16.386 bn
5.03%
1 ene 2009 año
363.185 bn
+21.241 bn
6.21%
1 ene 2010 año
376.12 bn
+12.935 bn
3.56%
1 ene 2011 año
386.739 bn
+10.62 bn
2.82%
1 ene 2012 año
394.371 bn
+7.632 bn
1.97%
1 ene 2013 año
396.361 bn
+1.99 bn
0.5%
1 ene 2014 año
399.626 bn
+3.265 bn
0.82%
1 ene 2015 año
410.748 bn
+11.122 bn
2.78%
1 ene 2016 año
422.997 bn
+12.25 bn
2.98%
Ranking de los países por los datos estadísticos actuales


Comentarios: