29
/es/
es
AIzaSyAYiBZKx7MnpbEhh9jyipgxe19OcubqV5w
April 1, 2024
256290
Sweden
SWE
true
2
1
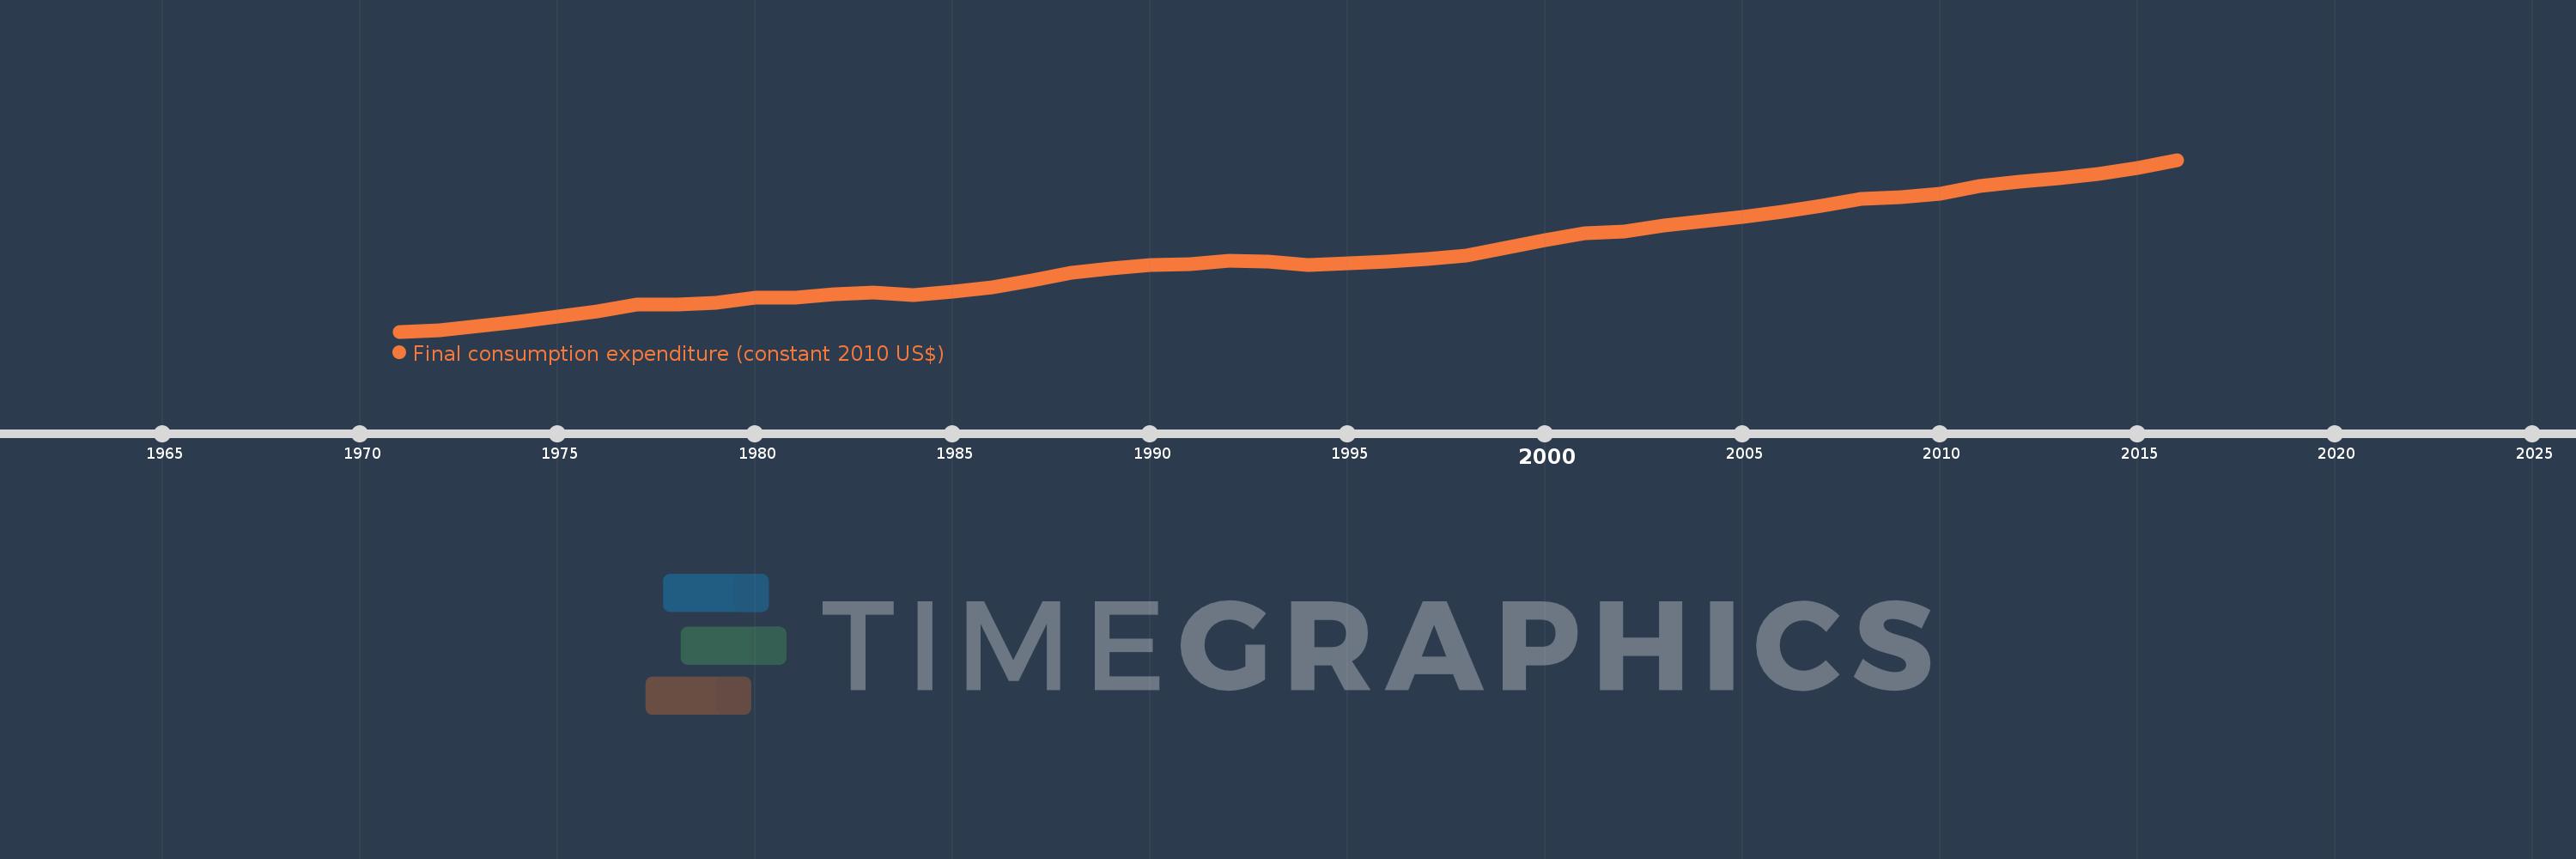
Final consumption expenditure (constant 2010 US$)
2016,2015,2014,2013,2012,2011,2010,2009,2008,2007,2006,2005,2004,2003,2002,2001,2000,1999,1998,1997,1996,1995,1994,1993,1992,1991,1990,1989,1988,1987,1986,1985,1984,1983,1982,1981,1980,1979,1978,1977,1976,1975,1974,1973,1972,1971
Estas estadísticas en otros países:
AfghanistanAlbaniaAlgeriaAngolaAntigua and BarbudaArab WorldArgentinaArmeniaArubaAustraliaAustriaAzerbaijanBahamas, TheBahrainBangladeshBarbadosBelarusBelgiumBelizeBeninBermudaBhutanBoliviaBosnia and HerzegovinaBotswanaBrazilBrunei DarussalamBulgariaBurkina FasoBurundiCabo VerdeCambodiaCameroonCanadaCaribbean small statesCentral African RepublicCentral Europe and the BalticsChadChileChinaColombiaComorosCongo, Dem. Rep.Congo, Rep.Costa RicaCote d'IvoireCroatiaCubaCyprusCzech RepublicDenmarkDominicaDominican RepublicEarly-demographic dividendEast Asia & PacificEast Asia & Pacific (excluding high income)East Asia & Pacific (IDA & IBRD countries)EcuadorEgypt, Arab Rep.El SalvadorEquatorial GuineaEritreaEstoniaEuro areaEurope & Central AsiaEurope & Central Asia (excluding high income)Europe & Central Asia (IDA & IBRD countries)European UnionFaroe IslandsFinlandFranceGabonGambia, TheGeorgiaGermanyGhanaGreeceGrenadaGuatemalaGuineaGuinea-BissauGuyanaHaitiHeavily indebted poor countries (HIPC)High incomeHondurasHong Kong SAR, ChinaHungaryIBRD onlyIcelandIDA & IBRD totalIDA blendIDA onlyIDA totalIndiaIndonesiaIran, Islamic Rep.IrelandIsraelItalyJamaicaJapanJordanKazakhstanKenyaKorea, Rep.KosovoKuwaitKyrgyz RepublicLao PDRLate-demographic dividendLatin America & Caribbean Latin America & Caribbean (excluding high income)Latin America & the Caribbean (IDA & IBRD countries)LatviaLeast developed countries: UN classificationLebanonLiberiaLithuaniaLow & middle incomeLow incomeLower middle incomeLuxembourgMacao SAR, ChinaMacedonia, FYRMadagascarMalawiMalaysiaMaliMaltaMauritaniaMauritiusMexicoMiddle East & North AfricaMiddle East & North Africa (excluding high income)Middle East & North Africa (IDA & IBRD countries)Middle incomeMoldovaMongoliaMontenegroMoroccoMozambiqueNamibiaNepalNetherlandsNew ZealandNicaraguaNigerNigeriaNorth AmericaNorwayOECD membersOmanOther small statesPakistanPanamaParaguayPeruPhilippinesPolandPortugalPost-demographic dividendPre-demographic dividendPuerto RicoQatarRomaniaRussian FederationRwandaSaudi ArabiaSenegalSerbiaSeychellesSierra LeoneSingaporeSlovak RepublicSloveniaSmall statesSouth AfricaSouth AsiaSouth Asia (IDA & IBRD)South SudanSpainSri LankaSt. Kitts and NevisSt. LuciaSt. Vincent and the GrenadinesSub-Saharan Africa Sub-Saharan Africa (excluding high income)Sub-Saharan Africa (IDA & IBRD countries)SudanSurinameSwazilandSwedenSwitzerlandTajikistanTanzaniaThailandTimor-LesteTogoTongaTrinidad and TobagoTunisiaTurkeyUgandaUkraineUnited Arab EmiratesUnited KingdomUnited StatesUpper middle incomeUruguayUzbekistanVanuatuVenezuela, RBVietnamWest Bank and GazaWorldYemen, Rep.ZambiaZimbabwe línea de tiempo (timeline):
En esta escala de tiempo se presenta un gráfico de 1971 y 2016 de Sweden. Los datos de 1970 están ausentes. El número de observaciones reales por fecha: 46.
Fuente (nombre):
Indicadores del desarrollo mundial
Fuente (organización):
World Bank national accounts data, and OECD National Accounts data files.
Categorías:
Economy & Growth
Se ha actualizado:
23 abr 2017 año
Los indicadores de los cambios de valor en los últimos años
Mínimo:
174.713 bn
1 ene 1971 año
Máximo:
380.867 bn
1 ene 2016 año
A la fecha de observación
Valor
Cambio absoluto
El cambio con respecto al valor anterior
1 ene 1971 año
174.713 bn
+174.713 bn
0.0%
1 ene 1972 año
176.097 bn
+1.384 bn
0.79%
1 ene 1973 año
181.556 bn
+5.459 bn
3.1%
1 ene 1974 año
186.252 bn
+4.696 bn
2.59%
1 ene 1975 año
192.341 bn
+6.089 bn
3.27%
1 ene 1976 año
198.911 bn
+6.57 bn
3.42%
1 ene 1977 año
206.672 bn
+7.761 bn
3.9%
1 ene 1978 año
207.347 bn
+674.433 millones
0.33%
1 ene 1979 año
208.79 bn
+1.443 bn
0.7%
1 ene 1980 año
215.56 bn
+6.77 bn
3.24%
1 ene 1981 año
215.892 bn
+331.675 millones
0.15%
1 ene 1982 año
219.729 bn
+3.838 bn
1.78%
1 ene 1983 año
221.547 bn
+1.818 bn
0.83%
1 ene 1984 año
218.74 bn
-2.807 bn
-1.27%
1 ene 1985 año
222.863 bn
+4.123 bn
1.88%
1 ene 1986 año
227.906 bn
+5.043 bn
2.26%
1 ene 1987 año
236.315 bn
+8.409 bn
3.69%
1 ene 1988 año
245.015 bn
+8.7 bn
3.68%
1 ene 1989 año
250.381 bn
+5.366 bn
2.19%
1 ene 1990 año
254.253 bn
+3.872 bn
1.55%
1 ene 1991 año
255.515 bn
+1.262 bn
0.5%
1 ene 1992 año
259.652 bn
+4.136 bn
1.62%
1 ene 1993 año
259.181 bn
-470.669 millones
-0.18%
1 ene 1994 año
254.481 bn
-4.701 bn
-1.81%
1 ene 1995 año
256.829 bn
+2.348 bn
0.92%
1 ene 1996 año
258.887 bn
+2.058 bn
0.8%
1 ene 1997 año
261.824 bn
+2.937 bn
1.13%
1 ene 1998 año
266.165 bn
+4.341 bn
1.66%
1 ene 1999 año
275.41 bn
+9.245 bn
3.47%
1 ene 2000 año
284.293 bn
+8.884 bn
3.23%
1 ene 2001 año
293.06 bn
+8.766 bn
3.08%
1 ene 2002 año
294.639 bn
+1.579 bn
0.54%
1 ene 2003 año
301.799 bn
+7.161 bn
2.43%
1 ene 2004 año
307.028 bn
+5.229 bn
1.73%
1 ene 2005 año
312.285 bn
+5.257 bn
1.71%
1 ene 2006 año
318.289 bn
+6.003 bn
1.92%
1 ene 2007 año
325.608 bn
+7.319 bn
2.3%
1 ene 2008 año
334.166 bn
+8.558 bn
2.63%
1 ene 2009 año
336.23 bn
+2.064 bn
0.62%
1 ene 2010 año
339.685 bn
+3.455 bn
1.03%
1 ene 2011 año
349.776 bn
+10.091 bn
2.97%
1 ene 2012 año
355.026 bn
+5.249 bn
1.5%
1 ene 2013 año
358.227 bn
+3.201 bn
0.9%
1 ene 2014 año
364.157 bn
+5.931 bn
1.66%
1 ene 2015 año
371.096 bn
+6.939 bn
1.91%
1 ene 2016 año
380.867 bn
+9.77 bn
2.63%
Ranking de los países por los datos estadísticos actuales


Comentarios: