29
/es/
es
AIzaSyAYiBZKx7MnpbEhh9jyipgxe19OcubqV5w
April 1, 2024
223517
Philippines
PHL
true
2
1
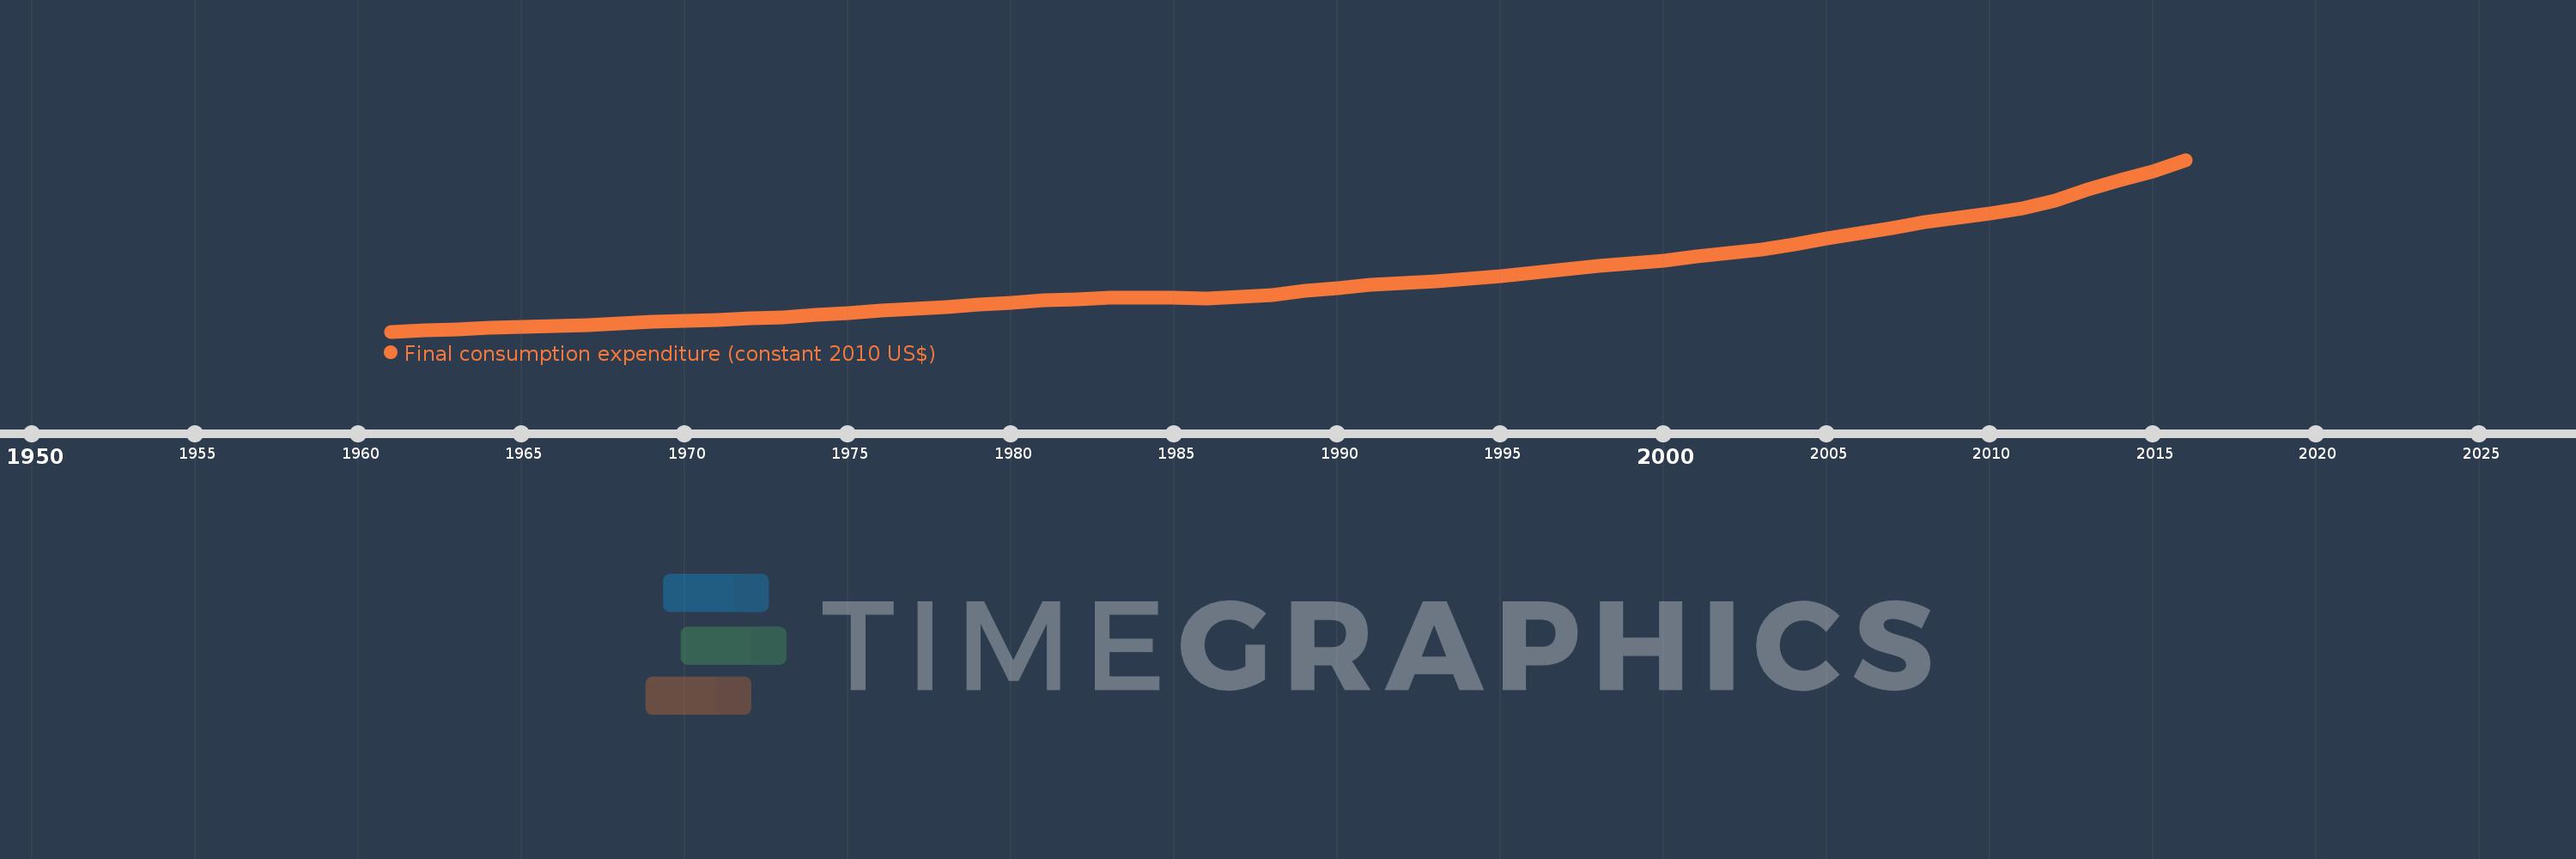
Final consumption expenditure (constant 2010 US$)
2016,2015,2014,2013,2012,2011,2010,2009,2008,2007,2006,2005,2004,2003,2002,2001,2000,1999,1998,1997,1996,1995,1994,1993,1992,1991,1990,1989,1988,1987,1986,1985,1984,1983,1982,1981,1980,1979,1978,1977,1976,1975,1974,1973,1972,1971,1970,1969,1968,1967,1966,1965,1964,1963,1962,1961
Estas estadísticas en otros países:
AfghanistanAlbaniaAlgeriaAngolaAntigua and BarbudaArab WorldArgentinaArmeniaArubaAustraliaAustriaAzerbaijanBahamas, TheBahrainBangladeshBarbadosBelarusBelgiumBelizeBeninBermudaBhutanBoliviaBosnia and HerzegovinaBotswanaBrazilBrunei DarussalamBulgariaBurkina FasoBurundiCabo VerdeCambodiaCameroonCanadaCaribbean small statesCentral African RepublicCentral Europe and the BalticsChadChileChinaColombiaComorosCongo, Dem. Rep.Congo, Rep.Costa RicaCote d'IvoireCroatiaCubaCyprusCzech RepublicDenmarkDominicaDominican RepublicEarly-demographic dividendEast Asia & PacificEast Asia & Pacific (excluding high income)East Asia & Pacific (IDA & IBRD countries)EcuadorEgypt, Arab Rep.El SalvadorEquatorial GuineaEritreaEstoniaEuro areaEurope & Central AsiaEurope & Central Asia (excluding high income)Europe & Central Asia (IDA & IBRD countries)European UnionFaroe IslandsFinlandFranceGabonGambia, TheGeorgiaGermanyGhanaGreeceGrenadaGuatemalaGuineaGuinea-BissauGuyanaHaitiHeavily indebted poor countries (HIPC)High incomeHondurasHong Kong SAR, ChinaHungaryIBRD onlyIcelandIDA & IBRD totalIDA blendIDA onlyIDA totalIndiaIndonesiaIran, Islamic Rep.IrelandIsraelItalyJamaicaJapanJordanKazakhstanKenyaKorea, Rep.KosovoKuwaitKyrgyz RepublicLao PDRLate-demographic dividendLatin America & Caribbean Latin America & Caribbean (excluding high income)Latin America & the Caribbean (IDA & IBRD countries)LatviaLeast developed countries: UN classificationLebanonLiberiaLithuaniaLow & middle incomeLow incomeLower middle incomeLuxembourgMacao SAR, ChinaMacedonia, FYRMadagascarMalawiMalaysiaMaliMaltaMauritaniaMauritiusMexicoMiddle East & North AfricaMiddle East & North Africa (excluding high income)Middle East & North Africa (IDA & IBRD countries)Middle incomeMoldovaMongoliaMontenegroMoroccoMozambiqueNamibiaNepalNetherlandsNew ZealandNicaraguaNigerNigeriaNorth AmericaNorwayOECD membersOmanOther small statesPakistanPanamaParaguayPeruPhilippinesPolandPortugalPost-demographic dividendPre-demographic dividendPuerto RicoQatarRomaniaRussian FederationRwandaSaudi ArabiaSenegalSerbiaSeychellesSierra LeoneSingaporeSlovak RepublicSloveniaSmall statesSouth AfricaSouth AsiaSouth Asia (IDA & IBRD)South SudanSpainSri LankaSt. Kitts and NevisSt. LuciaSt. Vincent and the GrenadinesSub-Saharan Africa Sub-Saharan Africa (excluding high income)Sub-Saharan Africa (IDA & IBRD countries)SudanSurinameSwazilandSwedenSwitzerlandTajikistanTanzaniaThailandTimor-LesteTogoTongaTrinidad and TobagoTunisiaTurkeyUgandaUkraineUnited Arab EmiratesUnited KingdomUnited StatesUpper middle incomeUruguayUzbekistanVanuatuVenezuela, RBVietnamWest Bank and GazaWorldYemen, Rep.ZambiaZimbabwe línea de tiempo (timeline):
En esta escala de tiempo se presenta un gráfico de 1961 y 2016 de Philippines. Los datos de 1960 están ausentes. El número de observaciones reales por fecha: 56.
Fuente (nombre):
Indicadores del desarrollo mundial
Fuente (organización):
World Bank national accounts data, and OECD National Accounts data files.
Categorías:
Economy & Growth
Se ha actualizado:
23 abr 2017 año
Los indicadores de los cambios de valor en los últimos años
Mínimo:
22.353 bn
1 ene 1961 año
Máximo:
217.292 bn
1 ene 2016 año
A la fecha de observación
Valor
Cambio absoluto
El cambio con respecto al valor anterior
1 ene 1961 año
22.353 bn
+22.353 bn
0.0%
1 ene 1962 año
23.468 bn
+1.115 bn
4.99%
1 ene 1963 año
24.744 bn
+1.276 bn
5.44%
1 ene 1964 año
26.264 bn
+1.52 bn
6.14%
1 ene 1965 año
27.316 bn
+1.052 bn
4.01%
1 ene 1966 año
28.637 bn
+1.321 bn
4.84%
1 ene 1967 año
29.972 bn
+1.335 bn
4.66%
1 ene 1968 año
31.634 bn
+1.661 bn
5.54%
1 ene 1969 año
33.165 bn
+1.531 bn
4.84%
1 ene 1970 año
34.538 bn
+1.373 bn
4.14%
1 ene 1971 año
35.671 bn
+1.133 bn
3.28%
1 ene 1972 año
37.079 bn
+1.408 bn
3.95%
1 ene 1973 año
38.656 bn
+1.577 bn
4.25%
1 ene 1974 año
41.128 bn
+2.472 bn
6.4%
1 ene 1975 año
43.588 bn
+2.46 bn
5.98%
1 ene 1976 año
45.832 bn
+2.244 bn
5.15%
1 ene 1977 año
47.96 bn
+2.127 bn
4.64%
1 ene 1978 año
50.238 bn
+2.279 bn
4.75%
1 ene 1979 año
52.728 bn
+2.49 bn
4.96%
1 ene 1980 año
55.216 bn
+2.488 bn
4.72%
1 ene 1981 año
57.657 bn
+2.441 bn
4.42%
1 ene 1982 año
58.823 bn
+1.166 bn
2.02%
1 ene 1983 año
61.111 bn
+2.288 bn
3.89%
1 ene 1984 año
61.123 bn
+11.98 millones
0.02%
1 ene 1985 año
60.511 bn
-611.893 millones
-1.0%
1 ene 1986 año
59.818 bn
-693.822 millones
-1.15%
1 ene 1987 año
61.638 bn
+1.82 bn
3.04%
1 ene 1988 año
64.175 bn
+2.537 bn
4.12%
1 ene 1989 año
68.339 bn
+4.164 bn
6.49%
1 ene 1990 año
71.888 bn
+3.549 bn
5.19%
1 ene 1991 año
75.851 bn
+3.963 bn
5.51%
1 ene 1992 año
77.242 bn
+1.391 bn
1.83%
1 ene 1993 año
79.462 bn
+2.22 bn
2.87%
1 ene 1994 año
82.101 bn
+2.639 bn
3.32%
1 ene 1995 año
85.336 bn
+3.235 bn
3.94%
1 ene 1996 año
88.73 bn
+3.394 bn
3.98%
1 ene 1997 año
92.791 bn
+4.061 bn
4.58%
1 ene 1998 año
97.39 bn
+4.599 bn
4.96%
1 ene 1999 año
100.249 bn
+2.859 bn
2.94%
1 ene 2000 año
103.108 bn
+2.859 bn
2.85%
1 ene 2001 año
107.553 bn
+4.445 bn
4.31%
1 ene 2002 año
111.111 bn
+3.558 bn
3.31%
1 ene 2003 año
115.474 bn
+4.363 bn
3.93%
1 ene 2004 año
121.557 bn
+6.082 bn
5.27%
1 ene 2005 año
128.244 bn
+6.687 bn
5.5%
1 ene 2006 año
133.571 bn
+5.327 bn
4.15%
1 ene 2007 año
140.12 bn
+6.549 bn
4.9%
1 ene 2008 año
146.959 bn
+6.839 bn
4.88%
1 ene 2009 año
151.766 bn
+4.807 bn
3.27%
1 ene 2010 año
156.83 bn
+5.064 bn
3.34%
1 ene 2011 año
162.212 bn
+5.382 bn
3.43%
1 ene 2012 año
170.562 bn
+8.35 bn
5.15%
1 ene 2013 año
183.715 bn
+13.153 bn
7.71%
1 ene 2014 año
193.9 bn
+10.185 bn
5.54%
1 ene 2015 año
204.054 bn
+10.154 bn
5.24%
1 ene 2016 año
217.292 bn
+13.238 bn
6.49%
Ranking de los países por los datos estadísticos actuales


Comentarios: