29
/es/
es
AIzaSyAYiBZKx7MnpbEhh9jyipgxe19OcubqV5w
April 1, 2024
38120
IDA blend
IDB
false
2
1
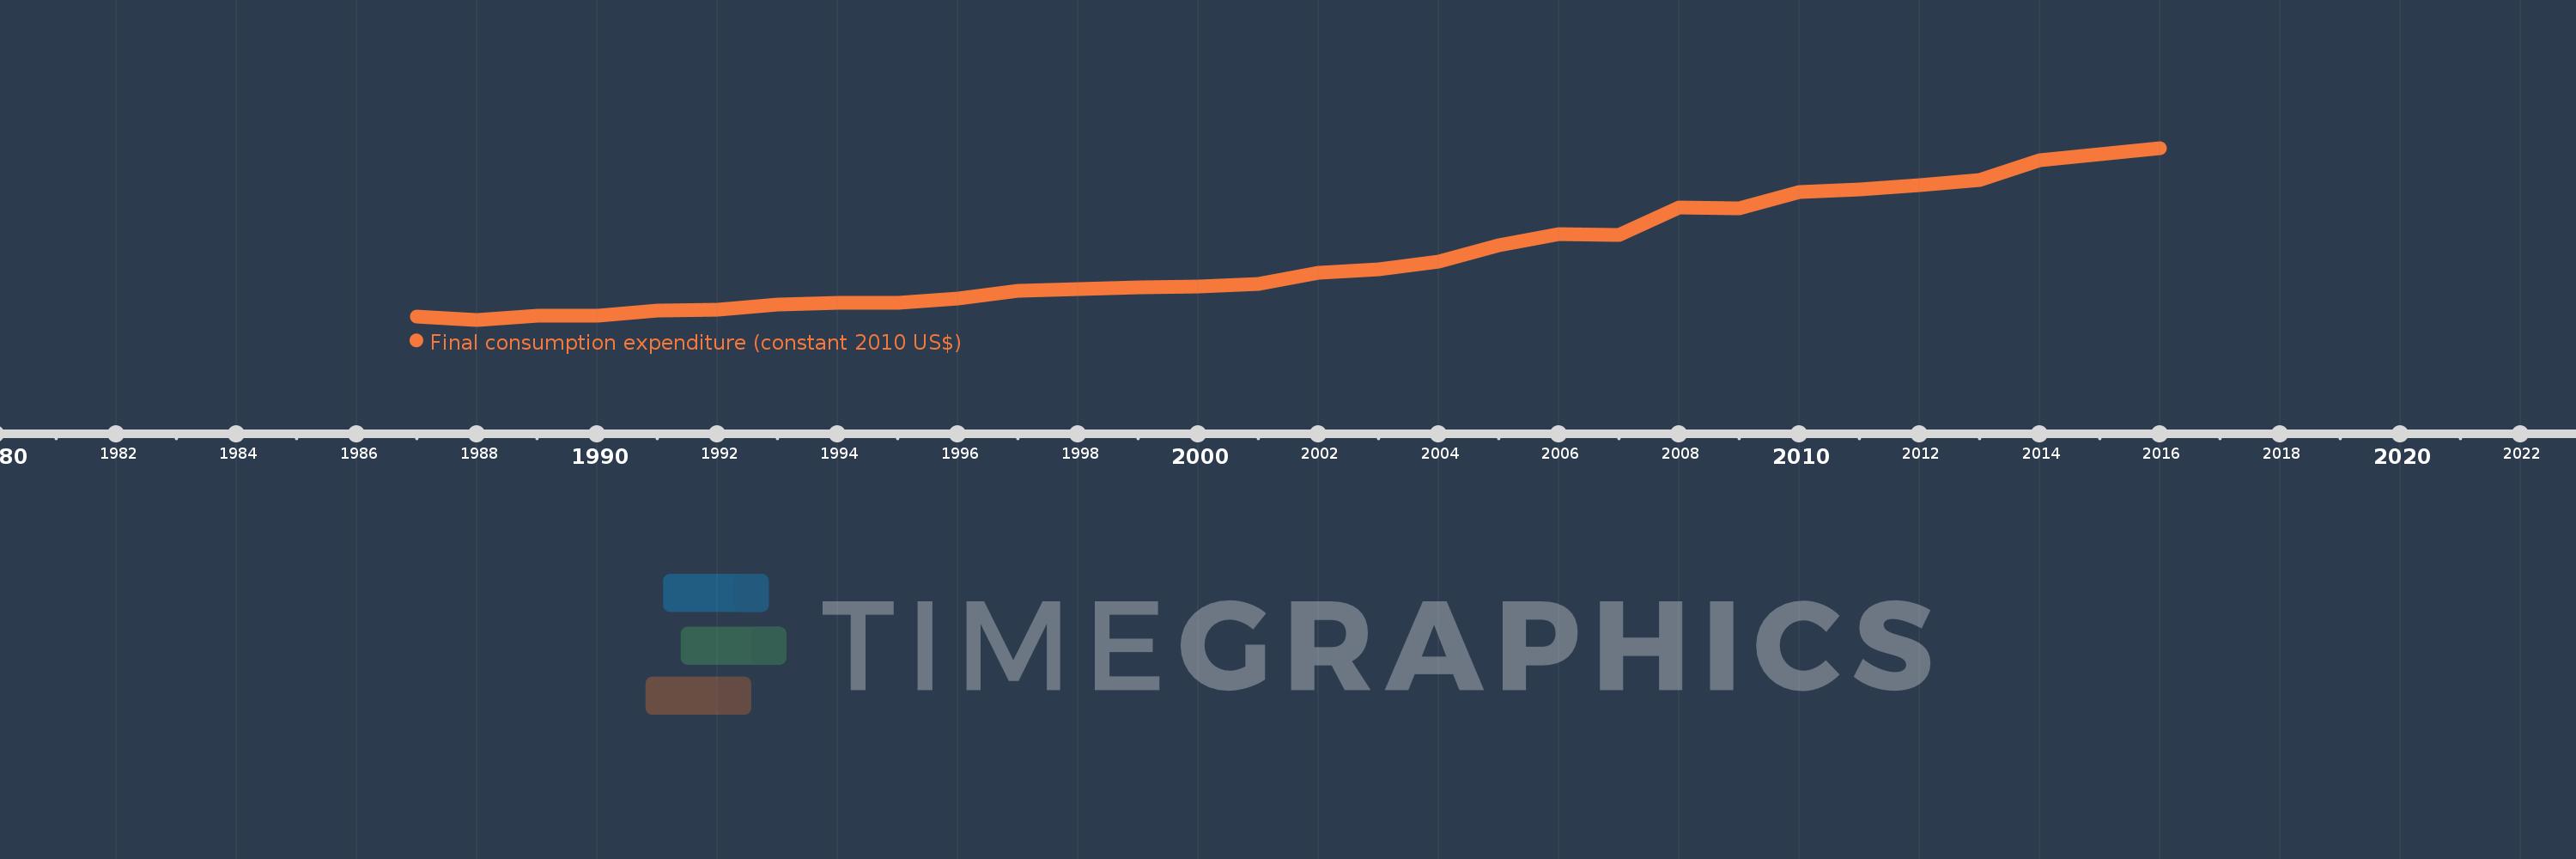
Final consumption expenditure (constant 2010 US$)
2016,2015,2014,2013,2012,2011,2010,2009,2008,2007,2006,2005,2004,2003,2002,2001,2000,1999,1998,1997,1996,1995,1994,1993,1992,1991,1990,1989,1988,1987
Estas estadísticas en otros países:
AfghanistanAlbaniaAlgeriaAngolaAntigua and BarbudaArab WorldArgentinaArmeniaArubaAustraliaAustriaAzerbaijanBahamas, TheBahrainBangladeshBarbadosBelarusBelgiumBelizeBeninBermudaBhutanBoliviaBosnia and HerzegovinaBotswanaBrazilBrunei DarussalamBulgariaBurkina FasoBurundiCabo VerdeCambodiaCameroonCanadaCaribbean small statesCentral African RepublicCentral Europe and the BalticsChadChileChinaColombiaComorosCongo, Dem. Rep.Congo, Rep.Costa RicaCote d'IvoireCroatiaCubaCyprusCzech RepublicDenmarkDominicaDominican RepublicEarly-demographic dividendEast Asia & PacificEast Asia & Pacific (excluding high income)East Asia & Pacific (IDA & IBRD countries)EcuadorEgypt, Arab Rep.El SalvadorEquatorial GuineaEritreaEstoniaEuro areaEurope & Central AsiaEurope & Central Asia (excluding high income)Europe & Central Asia (IDA & IBRD countries)European UnionFaroe IslandsFinlandFranceGabonGambia, TheGeorgiaGermanyGhanaGreeceGrenadaGuatemalaGuineaGuinea-BissauGuyanaHaitiHeavily indebted poor countries (HIPC)High incomeHondurasHong Kong SAR, ChinaHungaryIBRD onlyIcelandIDA & IBRD totalIDA blendIDA onlyIDA totalIndiaIndonesiaIran, Islamic Rep.IrelandIsraelItalyJamaicaJapanJordanKazakhstanKenyaKorea, Rep.KosovoKuwaitKyrgyz RepublicLao PDRLate-demographic dividendLatin America & Caribbean Latin America & Caribbean (excluding high income)Latin America & the Caribbean (IDA & IBRD countries)LatviaLeast developed countries: UN classificationLebanonLiberiaLithuaniaLow & middle incomeLow incomeLower middle incomeLuxembourgMacao SAR, ChinaMacedonia, FYRMadagascarMalawiMalaysiaMaliMaltaMauritaniaMauritiusMexicoMiddle East & North AfricaMiddle East & North Africa (excluding high income)Middle East & North Africa (IDA & IBRD countries)Middle incomeMoldovaMongoliaMontenegroMoroccoMozambiqueNamibiaNepalNetherlandsNew ZealandNicaraguaNigerNigeriaNorth AmericaNorwayOECD membersOmanOther small statesPakistanPanamaParaguayPeruPhilippinesPolandPortugalPost-demographic dividendPre-demographic dividendPuerto RicoQatarRomaniaRussian FederationRwandaSaudi ArabiaSenegalSerbiaSeychellesSierra LeoneSingaporeSlovak RepublicSloveniaSmall statesSouth AfricaSouth AsiaSouth Asia (IDA & IBRD)South SudanSpainSri LankaSt. Kitts and NevisSt. LuciaSt. Vincent and the GrenadinesSub-Saharan Africa Sub-Saharan Africa (excluding high income)Sub-Saharan Africa (IDA & IBRD countries)SudanSurinameSwazilandSwedenSwitzerlandTajikistanTanzaniaThailandTimor-LesteTogoTongaTrinidad and TobagoTunisiaTurkeyUgandaUkraineUnited Arab EmiratesUnited KingdomUnited StatesUpper middle incomeUruguayUzbekistanVanuatuVenezuela, RBVietnamWest Bank and GazaWorldYemen, Rep.ZambiaZimbabwe línea de tiempo (timeline):
En esta escala de tiempo se presenta un gráfico de 1987 y 2016 de IDA blend. Los datos de 1986 están ausentes. El número de observaciones reales por fecha: 30.
Fuente (nombre):
Indicadores del desarrollo mundial
Fuente (organización):
World Bank national accounts data, and OECD National Accounts data files.
Categorías:
Economy & Growth
Se ha actualizado:
23 abr 2017 año
Los indicadores de los cambios de valor en los últimos años
Mínimo:
200.31 bn
1 ene 1988 año
Máximo:
812.529 bn
1 ene 2016 año
A la fecha de observación
Valor
Cambio absoluto
El cambio con respecto al valor anterior
1 ene 1987 año
212.3 bn
+212.3 bn
0.0%
1 ene 1988 año
200.31 bn
-11.99 bn
-5.65%
1 ene 1989 año
213.492 bn
+13.182 bn
6.58%
1 ene 1990 año
213.898 bn
+405.755 millones
0.19%
1 ene 1991 año
231.697 bn
+17.799 bn
8.32%
1 ene 1992 año
235.455 bn
+3.758 bn
1.62%
1 ene 1993 año
253.921 bn
+18.466 bn
7.84%
1 ene 1994 año
260.231 bn
+6.31 bn
2.48%
1 ene 1995 año
259.353 bn
-878.211 millones
-0.34%
1 ene 1996 año
274.489 bn
+15.136 bn
5.84%
1 ene 1997 año
303.428 bn
+28.939 bn
10.54%
1 ene 1998 año
308.827 bn
+5.399 bn
1.78%
1 ene 1999 año
316.284 bn
+7.457 bn
2.41%
1 ene 2000 año
319.691 bn
+3.407 bn
1.08%
1 ene 2001 año
327.143 bn
+7.452 bn
2.33%
1 ene 2002 año
368.567 bn
+41.424 bn
12.66%
1 ene 2003 año
379.948 bn
+11.381 bn
3.09%
1 ene 2004 año
408.279 bn
+28.332 bn
7.46%
1 ene 2005 año
464.922 bn
+56.643 bn
13.87%
1 ene 2006 año
505.884 bn
+40.961 bn
8.81%
1 ene 2007 año
503.677 bn
-2.207 bn
-0.44%
1 ene 2008 año
600.513 bn
+96.836 bn
19.23%
1 ene 2009 año
596.694 bn
-3.819 bn
-0.64%
1 ene 2010 año
655.847 bn
+59.153 bn
9.91%
1 ene 2011 año
665.997 bn
+10.149 bn
1.55%
1 ene 2012 año
679.159 bn
+13.163 bn
1.98%
1 ene 2013 año
699.631 bn
+20.472 bn
3.01%
1 ene 2014 año
767.838 bn
+68.206 bn
9.75%
1 ene 2015 año
790.077 bn
+22.239 bn
2.9%
1 ene 2016 año
812.529 bn
+22.452 bn
2.84%
Ranking de los países por los datos estadísticos actuales


Comentarios: