29
/es/
es
AIzaSyAYiBZKx7MnpbEhh9jyipgxe19OcubqV5w
April 1, 2024
118871
Denmark
DNK
true
2
1
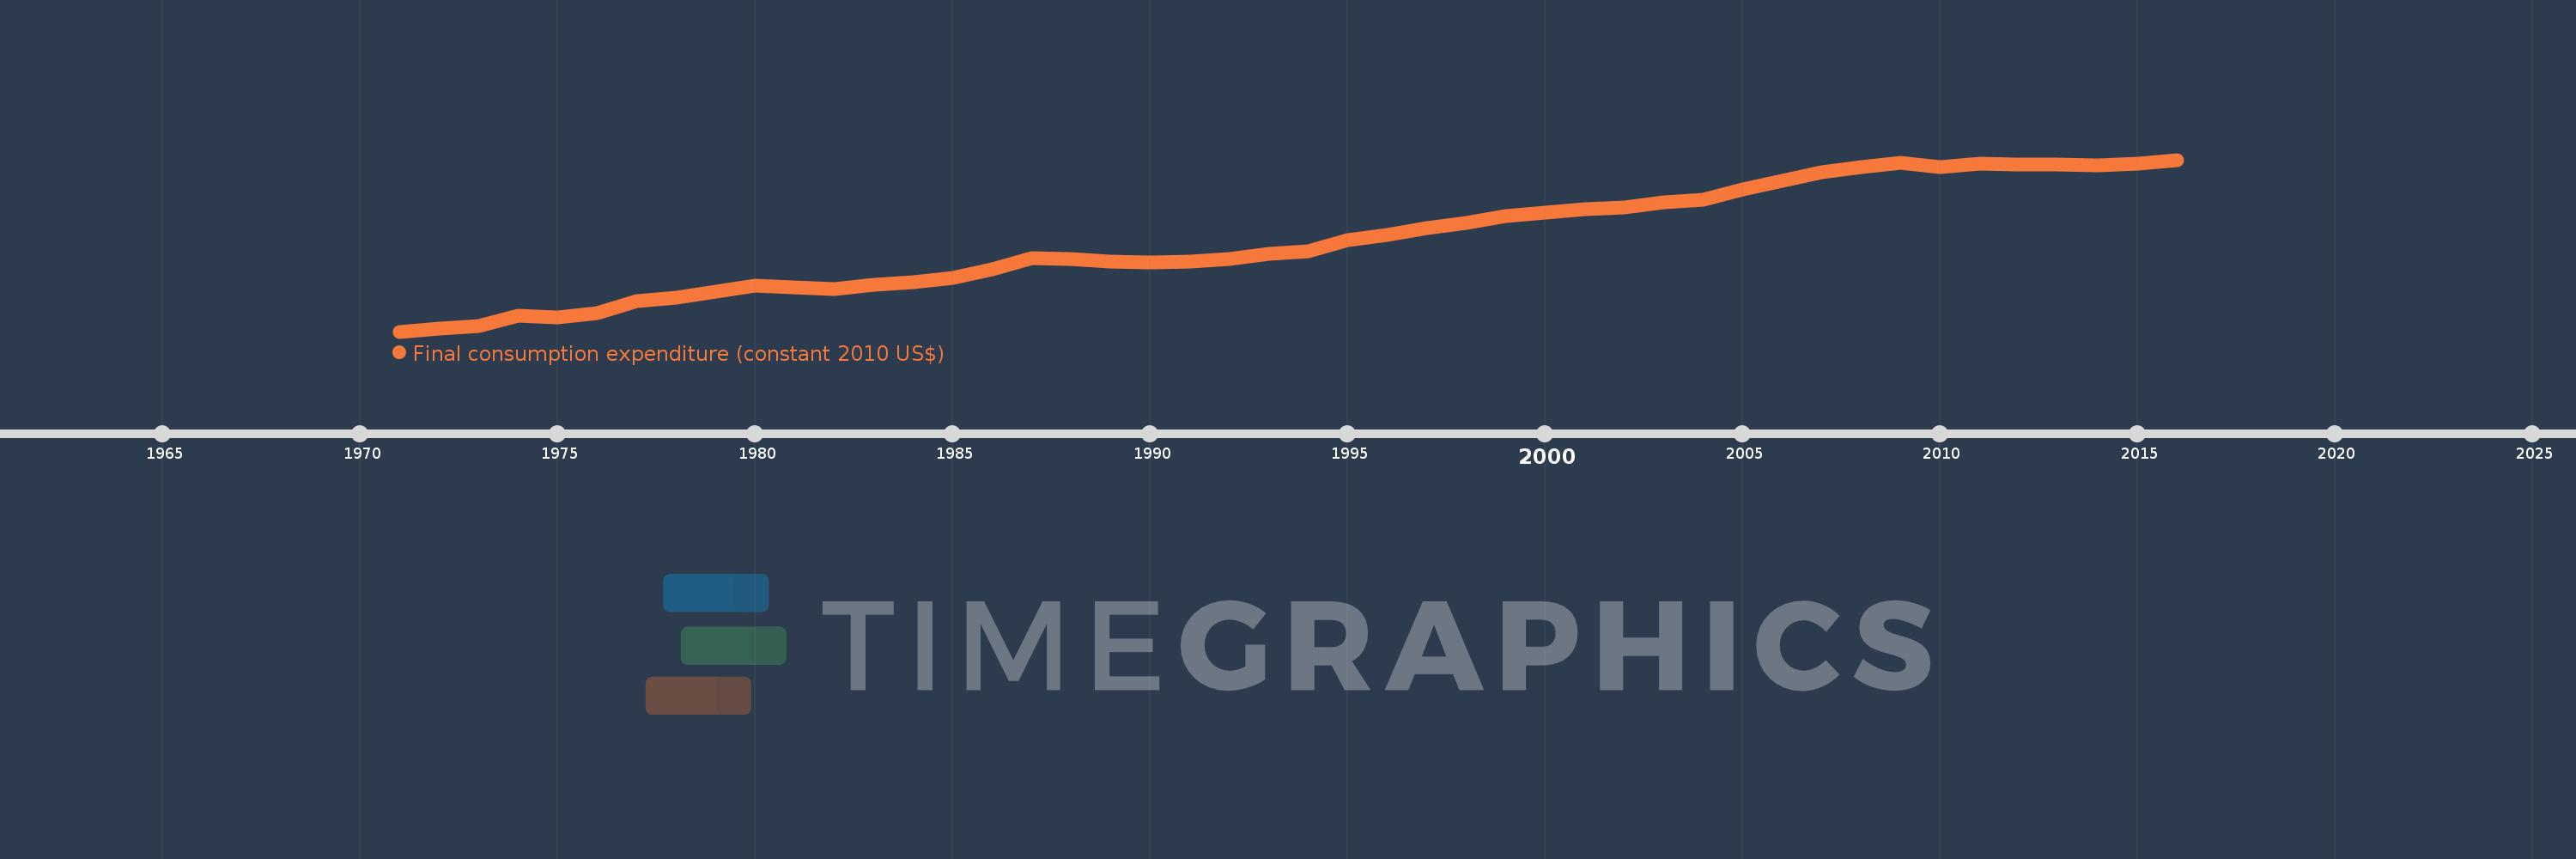
Final consumption expenditure (constant 2010 US$)
2016,2015,2014,2013,2012,2011,2010,2009,2008,2007,2006,2005,2004,2003,2002,2001,2000,1999,1998,1997,1996,1995,1994,1993,1992,1991,1990,1989,1988,1987,1986,1985,1984,1983,1982,1981,1980,1979,1978,1977,1976,1975,1974,1973,1972,1971
Estas estadísticas en otros países:
AfghanistanAlbaniaAlgeriaAngolaAntigua and BarbudaArab WorldArgentinaArmeniaArubaAustraliaAustriaAzerbaijanBahamas, TheBahrainBangladeshBarbadosBelarusBelgiumBelizeBeninBermudaBhutanBoliviaBosnia and HerzegovinaBotswanaBrazilBrunei DarussalamBulgariaBurkina FasoBurundiCabo VerdeCambodiaCameroonCanadaCaribbean small statesCentral African RepublicCentral Europe and the BalticsChadChileChinaColombiaComorosCongo, Dem. Rep.Congo, Rep.Costa RicaCote d'IvoireCroatiaCubaCyprusCzech RepublicDenmarkDominicaDominican RepublicEarly-demographic dividendEast Asia & PacificEast Asia & Pacific (excluding high income)East Asia & Pacific (IDA & IBRD countries)EcuadorEgypt, Arab Rep.El SalvadorEquatorial GuineaEritreaEstoniaEuro areaEurope & Central AsiaEurope & Central Asia (excluding high income)Europe & Central Asia (IDA & IBRD countries)European UnionFaroe IslandsFinlandFranceGabonGambia, TheGeorgiaGermanyGhanaGreeceGrenadaGuatemalaGuineaGuinea-BissauGuyanaHaitiHeavily indebted poor countries (HIPC)High incomeHondurasHong Kong SAR, ChinaHungaryIBRD onlyIcelandIDA & IBRD totalIDA blendIDA onlyIDA totalIndiaIndonesiaIran, Islamic Rep.IrelandIsraelItalyJamaicaJapanJordanKazakhstanKenyaKorea, Rep.KosovoKuwaitKyrgyz RepublicLao PDRLate-demographic dividendLatin America & Caribbean Latin America & Caribbean (excluding high income)Latin America & the Caribbean (IDA & IBRD countries)LatviaLeast developed countries: UN classificationLebanonLiberiaLithuaniaLow & middle incomeLow incomeLower middle incomeLuxembourgMacao SAR, ChinaMacedonia, FYRMadagascarMalawiMalaysiaMaliMaltaMauritaniaMauritiusMexicoMiddle East & North AfricaMiddle East & North Africa (excluding high income)Middle East & North Africa (IDA & IBRD countries)Middle incomeMoldovaMongoliaMontenegroMoroccoMozambiqueNamibiaNepalNetherlandsNew ZealandNicaraguaNigerNigeriaNorth AmericaNorwayOECD membersOmanOther small statesPakistanPanamaParaguayPeruPhilippinesPolandPortugalPost-demographic dividendPre-demographic dividendPuerto RicoQatarRomaniaRussian FederationRwandaSaudi ArabiaSenegalSerbiaSeychellesSierra LeoneSingaporeSlovak RepublicSloveniaSmall statesSouth AfricaSouth AsiaSouth Asia (IDA & IBRD)South SudanSpainSri LankaSt. Kitts and NevisSt. LuciaSt. Vincent and the GrenadinesSub-Saharan Africa Sub-Saharan Africa (excluding high income)Sub-Saharan Africa (IDA & IBRD countries)SudanSurinameSwazilandSwedenSwitzerlandTajikistanTanzaniaThailandTimor-LesteTogoTongaTrinidad and TobagoTunisiaTurkeyUgandaUkraineUnited Arab EmiratesUnited KingdomUnited StatesUpper middle incomeUruguayUzbekistanVanuatuVenezuela, RBVietnamWest Bank and GazaWorldYemen, Rep.ZambiaZimbabwe línea de tiempo (timeline):
En esta escala de tiempo se presenta un gráfico de 1971 y 2016 de Denmark. Los datos de 1970 están ausentes. El número de observaciones reales por fecha: 46.
Fuente (nombre):
Indicadores del desarrollo mundial
Fuente (organización):
World Bank national accounts data, and OECD National Accounts data files.
Categorías:
Economy & Growth
Se ha actualizado:
23 abr 2017 año
Los indicadores de los cambios de valor en los últimos años
Mínimo:
117.005 bn
1 ene 1971 año
Máximo:
244.228 bn
1 ene 2016 año
A la fecha de observación
Valor
Cambio absoluto
El cambio con respecto al valor anterior
1 ene 1971 año
117.005 bn
+117.005 bn
0.0%
1 ene 1972 año
119.521 bn
+2.517 bn
2.15%
1 ene 1973 año
121.125 bn
+1.603 bn
1.34%
1 ene 1974 año
128.802 bn
+7.677 bn
6.34%
1 ene 1975 año
127.384 bn
-1.418 bn
-1.1%
1 ene 1976 año
130.492 bn
+3.108 bn
2.44%
1 ene 1977 año
139.34 bn
+8.847 bn
6.78%
1 ene 1978 año
142.285 bn
+2.945 bn
2.11%
1 ene 1979 año
146.828 bn
+4.543 bn
3.19%
1 ene 1980 año
151.072 bn
+4.245 bn
2.89%
1 ene 1981 año
149.699 bn
-1.373 bn
-0.91%
1 ene 1982 año
148.702 bn
-997.014 millones
-0.67%
1 ene 1983 año
151.709 bn
+3.006 bn
2.02%
1 ene 1984 año
153.77 bn
+2.061 bn
1.36%
1 ene 1985 año
156.843 bn
+3.074 bn
2.0%
1 ene 1986 año
162.878 bn
+6.034 bn
3.85%
1 ene 1987 año
171.618 bn
+8.74 bn
5.37%
1 ene 1988 año
170.591 bn
-1.026 bn
-0.6%
1 ene 1989 año
168.728 bn
-1.863 bn
-1.09%
1 ene 1990 año
168.207 bn
-520.838 millones
-0.31%
1 ene 1991 año
168.669 bn
+461.508 millones
0.27%
1 ene 1992 año
171.072 bn
+2.403 bn
1.42%
1 ene 1993 año
174.569 bn
+3.497 bn
2.04%
1 ene 1994 año
176.4 bn
+1.831 bn
1.05%
1 ene 1995 año
185.061 bn
+8.662 bn
4.91%
1 ene 1996 año
188.555 bn
+3.494 bn
1.89%
1 ene 1997 año
193.545 bn
+4.99 bn
2.65%
1 ene 1998 año
197.717 bn
+4.171 bn
2.16%
1 ene 1999 año
202.835 bn
+5.118 bn
2.59%
1 ene 2000 año
204.826 bn
+1.991 bn
0.98%
1 ene 2001 año
207.355 bn
+2.529 bn
1.23%
1 ene 2002 año
208.998 bn
+1.643 bn
0.79%
1 ene 2003 año
212.51 bn
+3.512 bn
1.68%
1 ene 2004 año
214.542 bn
+2.032 bn
0.96%
1 ene 2005 año
222.192 bn
+7.65 bn
3.57%
1 ene 2006 año
228.503 bn
+6.311 bn
2.84%
1 ene 2007 año
234.916 bn
+6.413 bn
2.81%
1 ene 2008 año
238.608 bn
+3.692 bn
1.57%
1 ene 2009 año
241.976 bn
+3.367 bn
1.41%
1 ene 2010 año
239.076 bn
-2.9 bn
-1.2%
1 ene 2011 año
241.356 bn
+2.28 bn
0.95%
1 ene 2012 año
240.473 bn
-882.808 millones
-0.37%
1 ene 2013 año
241.041 bn
+567.38 millones
0.24%
1 ene 2014 año
240.258 bn
-782.347 millones
-0.32%
1 ene 2015 año
241.229 bn
+970.644 millones
0.4%
1 ene 2016 año
244.228 bn
+2.999 bn
1.24%
Ranking de los países por los datos estadísticos actuales


Comentarios: