29
/es/
es
AIzaSyAYiBZKx7MnpbEhh9jyipgxe19OcubqV5w
April 1, 2024
50120
Middle East & North Africa (IDA & IBRD countries)
TMN
false
2
1
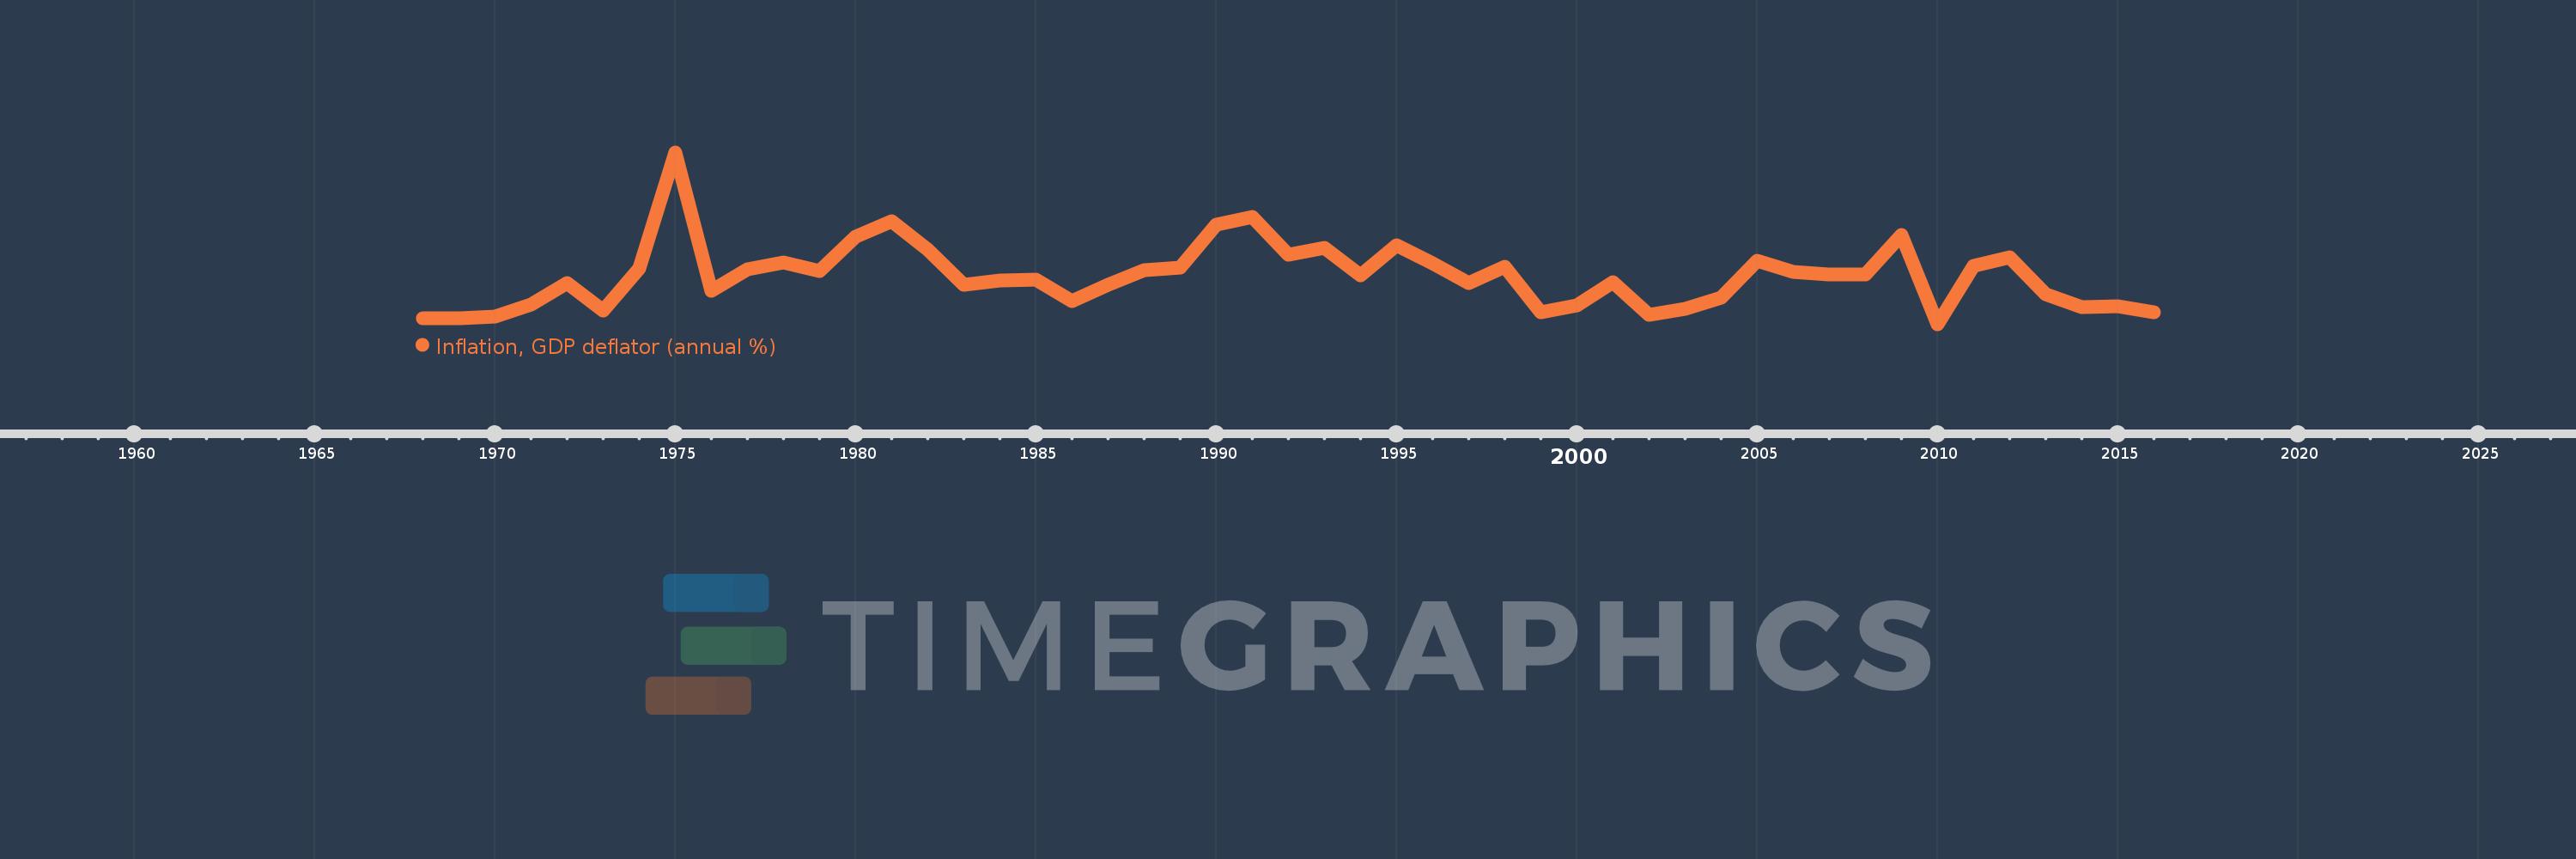
Inflation, GDP deflator (annual %)
2016,2015,2014,2013,2012,2011,2010,2009,2008,2007,2006,2005,2004,2003,2002,2001,2000,1999,1998,1997,1996,1995,1994,1993,1992,1991,1990,1989,1988,1987,1986,1985,1984,1983,1982,1981,1980,1979,1978,1977,1976,1975,1974,1973,1972,1971,1970,1969,1968
Estas estadísticas en otros países:
AfghanistanAlbaniaAlgeriaAndorraAngolaAntigua and BarbudaArab WorldArgentinaArmeniaArubaAustraliaAustriaAzerbaijanBahamas, TheBahrainBangladeshBarbadosBelarusBelgiumBelizeBeninBermudaBhutanBoliviaBosnia and HerzegovinaBotswanaBrazilBrunei DarussalamBulgariaBurkina FasoBurundiCabo VerdeCambodiaCameroonCanadaCaribbean small statesCayman IslandsCentral African RepublicCentral Europe and the BalticsChadChannel IslandsChileChinaColombiaComorosCongo, Dem. Rep.Congo, Rep.Costa RicaCote d'IvoireCroatiaCubaCyprusCzech RepublicDenmarkDjiboutiDominicaDominican RepublicEarly-demographic dividendEast Asia & PacificEast Asia & Pacific (excluding high income)East Asia & Pacific (IDA & IBRD countries)EcuadorEgypt, Arab Rep.El SalvadorEquatorial GuineaEritreaEstoniaEthiopiaEuro areaEurope & Central AsiaEurope & Central Asia (excluding high income)Europe & Central Asia (IDA & IBRD countries)European UnionFijiFinlandFragile and conflict affected situationsFranceFrench PolynesiaGabonGambia, TheGeorgiaGermanyGhanaGreeceGreenlandGrenadaGuatemalaGuineaGuinea-BissauGuyanaHaitiHeavily indebted poor countries (HIPC)High incomeHondurasHong Kong SAR, ChinaHungaryIBRD onlyIcelandIDA & IBRD totalIDA blendIDA onlyIDA totalIndiaIndonesiaIran, Islamic Rep.IraqIrelandIsle of ManIsraelItalyJamaicaJapanJordanKazakhstanKenyaKiribatiKorea, Rep.KosovoKuwaitKyrgyz RepublicLao PDRLate-demographic dividendLatin America & Caribbean Latin America & Caribbean (excluding high income)Latin America & the Caribbean (IDA & IBRD countries)LatviaLeast developed countries: UN classificationLebanonLesothoLiberiaLibyaLiechtensteinLithuaniaLow & middle incomeLow incomeLower middle incomeLuxembourgMacao SAR, ChinaMacedonia, FYRMadagascarMalawiMalaysiaMaldivesMaliMaltaMarshall IslandsMauritaniaMauritiusMexicoMicronesia, Fed. Sts.Middle East & North AfricaMiddle East & North Africa (excluding high income)Middle East & North Africa (IDA & IBRD countries)Middle incomeMoldovaMonacoMongoliaMontenegroMoroccoMozambiqueMyanmarNamibiaNauruNepalNetherlandsNew CaledoniaNew ZealandNicaraguaNigerNigeriaNorth AmericaNorwayOECD membersOmanOther small statesPacific island small statesPakistanPalauPanamaPapua New GuineaParaguayPeruPhilippinesPolandPortugalPost-demographic dividendPre-demographic dividendPuerto RicoQatarRomaniaRussian FederationRwandaSamoaSan MarinoSao Tome and PrincipeSaudi ArabiaSenegalSerbiaSeychellesSierra LeoneSingaporeSlovak RepublicSloveniaSmall statesSolomon IslandsSomaliaSouth AfricaSouth AsiaSouth Asia (IDA & IBRD)South SudanSpainSri LankaSt. Kitts and NevisSt. LuciaSt. Vincent and the GrenadinesSub-Saharan Africa Sub-Saharan Africa (excluding high income)Sub-Saharan Africa (IDA & IBRD countries)SudanSurinameSwazilandSwedenSwitzerlandSyrian Arab RepublicTajikistanTanzaniaThailandTimor-LesteTogoTongaTrinidad and TobagoTunisiaTurkeyTurkmenistanTuvaluUgandaUkraineUnited Arab EmiratesUnited KingdomUnited StatesUpper middle incomeUruguayUzbekistanVanuatuVenezuela, RBVietnamVirgin Islands (U.S.)West Bank and GazaWorldYemen, Rep.ZambiaZimbabwe línea de tiempo (timeline):
En esta escala de tiempo se presenta un gráfico de 1968 y 2016 de Middle East & North Africa (IDA & IBRD countries). Los datos de 1967 están ausentes. El número de observaciones reales por fecha: 49.
Fuente (nombre):
Indicadores del desarrollo mundial
Fuente (organización):
World Bank national accounts data, and OECD National Accounts data files.
Categorías:
Economy & Growth
Se ha actualizado:
23 abr 2017 año
Los indicadores de los cambios de valor en los últimos años
Mínimo:
0.147
1 ene 2010 año
Máximo:
29.451
1 ene 1975 año
A la fecha de observación
Valor
Cambio absoluto
El cambio con respecto al valor anterior
1 ene 1968 año
1.125
+1.125
0.0%
1 ene 1969 año
1.111
-0.014
-1.23%
1 ene 1970 año
1.381
+0.27
24.28%
1 ene 1971 año
3.468
+2.087
151.14%
1 ene 1972 año
7.208
+3.74
107.85%
1 ene 1973 año
2.511
-4.696
-65.16%
1 ene 1974 año
9.628
+7.116
283.39%
1 ene 1975 año
29.451
+19.823
205.9%
1 ene 1976 año
5.914
-23.537
-79.92%
1 ene 1977 año
9.512
+3.598
60.83%
1 ene 1978 año
10.717
+1.205
12.67%
1 ene 1979 año
9.251
-1.466
-13.68%
1 ene 1980 año
15.051
+5.799
62.69%
1 ene 1981 año
17.751
+2.701
17.94%
1 ene 1982 año
12.882
-4.869
-27.43%
1 ene 1983 año
6.836
-6.047
-46.94%
1 ene 1984 año
7.632
+0.796
11.65%
1 ene 1985 año
7.798
+0.166
2.18%
1 ene 1986 año
4.076
-3.722
-47.73%
1 ene 1987 año
6.868
+2.792
68.5%
1 ene 1988 año
9.368
+2.5
36.4%
1 ene 1989 año
9.746
+0.378
4.04%
1 ene 1990 año
17.16
+7.414
76.07%
1 ene 1991 año
18.441
+1.281
7.46%
1 ene 1992 año
11.994
-6.447
-34.96%
1 ene 1993 año
13.172
+1.178
9.82%
1 ene 1994 año
8.429
-4.743
-36.01%
1 ene 1995 año
13.623
+5.194
61.62%
1 ene 1996 año
10.59
-3.034
-22.27%
1 ene 1997 año
7.108
-3.482
-32.88%
1 ene 1998 año
9.878
+2.77
38.97%
1 ene 1999 año
2.205
-7.673
-77.68%
1 ene 2000 año
3.361
+1.157
52.48%
1 ene 2001 año
7.317
+3.956
117.67%
1 ene 2002 año
1.814
-5.503
-75.21%
1 ene 2003 año
2.735
+0.922
50.81%
1 ene 2004 año
4.731
+1.996
72.96%
1 ene 2005 año
11.0
+6.269
132.51%
1 ene 2006 año
9.09
-1.91
-17.36%
1 ene 2007 año
8.625
-0.465
-5.11%
1 ene 2008 año
8.642
+0.017
0.19%
1 ene 2009 año
15.311
+6.669
77.17%
1 ene 2010 año
0.147
-15.164
-99.04%
1 ene 2011 año
10.115
+9.968
6.79 mil%
1 ene 2012 año
11.606
+1.491
14.74%
1 ene 2013 año
5.188
-6.418
-55.3%
1 ene 2014 año
3.041
-2.147
-41.39%
1 ene 2015 año
3.204
+0.163
5.36%
1 ene 2016 año
2.115
-1.089
-33.99%
Ranking de los países por los datos estadísticos actuales


Comentarios: