29
/es/
es
AIzaSyAYiBZKx7MnpbEhh9jyipgxe19OcubqV5w
April 1, 2024
210526
Nicaragua
NIC
true
2
1
Inflation, GDP deflator (annual %)
2016,2015,2014,2013,2012,2011,2010,2009,2008,2007,2006,2005,2004,2003,2002,2001,2000,1999,1998,1997,1996,1995,1994,1993,1992,1991,1990,1989,1988,1987,1986,1985,1984,1983,1982,1981,1980,1979,1978,1977,1976,1975,1974,1973,1972,1971,1970,1969,1968,1967,1966,1965,1964,1963,1962
Estas estadísticas en otros países:
AfghanistanAlbaniaAlgeriaAndorraAngolaAntigua and BarbudaArab WorldArgentinaArmeniaArubaAustraliaAustriaAzerbaijanBahamas, TheBahrainBangladeshBarbadosBelarusBelgiumBelizeBeninBermudaBhutanBoliviaBosnia and HerzegovinaBotswanaBrazilBrunei DarussalamBulgariaBurkina FasoBurundiCabo VerdeCambodiaCameroonCanadaCaribbean small statesCayman IslandsCentral African RepublicCentral Europe and the BalticsChadChannel IslandsChileChinaColombiaComorosCongo, Dem. Rep.Congo, Rep.Costa RicaCote d'IvoireCroatiaCubaCyprusCzech RepublicDenmarkDjiboutiDominicaDominican RepublicEarly-demographic dividendEast Asia & PacificEast Asia & Pacific (excluding high income)East Asia & Pacific (IDA & IBRD countries)EcuadorEgypt, Arab Rep.El SalvadorEquatorial GuineaEritreaEstoniaEthiopiaEuro areaEurope & Central AsiaEurope & Central Asia (excluding high income)Europe & Central Asia (IDA & IBRD countries)European UnionFijiFinlandFragile and conflict affected situationsFranceFrench PolynesiaGabonGambia, TheGeorgiaGermanyGhanaGreeceGreenlandGrenadaGuatemalaGuineaGuinea-BissauGuyanaHaitiHeavily indebted poor countries (HIPC)High incomeHondurasHong Kong SAR, ChinaHungaryIBRD onlyIcelandIDA & IBRD totalIDA blendIDA onlyIDA totalIndiaIndonesiaIran, Islamic Rep.IraqIrelandIsle of ManIsraelItalyJamaicaJapanJordanKazakhstanKenyaKiribatiKorea, Rep.KosovoKuwaitKyrgyz RepublicLao PDRLate-demographic dividendLatin America & Caribbean Latin America & Caribbean (excluding high income)Latin America & the Caribbean (IDA & IBRD countries)LatviaLeast developed countries: UN classificationLebanonLesothoLiberiaLibyaLiechtensteinLithuaniaLow & middle incomeLow incomeLower middle incomeLuxembourgMacao SAR, ChinaMacedonia, FYRMadagascarMalawiMalaysiaMaldivesMaliMaltaMarshall IslandsMauritaniaMauritiusMexicoMicronesia, Fed. Sts.Middle East & North AfricaMiddle East & North Africa (excluding high income)Middle East & North Africa (IDA & IBRD countries)Middle incomeMoldovaMonacoMongoliaMontenegroMoroccoMozambiqueMyanmarNamibiaNauruNepalNetherlandsNew CaledoniaNew ZealandNicaraguaNigerNigeriaNorth AmericaNorwayOECD membersOmanOther small statesPacific island small statesPakistanPalauPanamaPapua New GuineaParaguayPeruPhilippinesPolandPortugalPost-demographic dividendPre-demographic dividendPuerto RicoQatarRomaniaRussian FederationRwandaSamoaSan MarinoSao Tome and PrincipeSaudi ArabiaSenegalSerbiaSeychellesSierra LeoneSingaporeSlovak RepublicSloveniaSmall statesSolomon IslandsSomaliaSouth AfricaSouth AsiaSouth Asia (IDA & IBRD)South SudanSpainSri LankaSt. Kitts and NevisSt. LuciaSt. Vincent and the GrenadinesSub-Saharan Africa Sub-Saharan Africa (excluding high income)Sub-Saharan Africa (IDA & IBRD countries)SudanSurinameSwazilandSwedenSwitzerlandSyrian Arab RepublicTajikistanTanzaniaThailandTimor-LesteTogoTongaTrinidad and TobagoTunisiaTurkeyTurkmenistanTuvaluUgandaUkraineUnited Arab EmiratesUnited KingdomUnited StatesUpper middle incomeUruguayUzbekistanVanuatuVenezuela, RBVietnamVirgin Islands (U.S.)West Bank and GazaWorldYemen, Rep.ZambiaZimbabwe línea de tiempo (timeline):
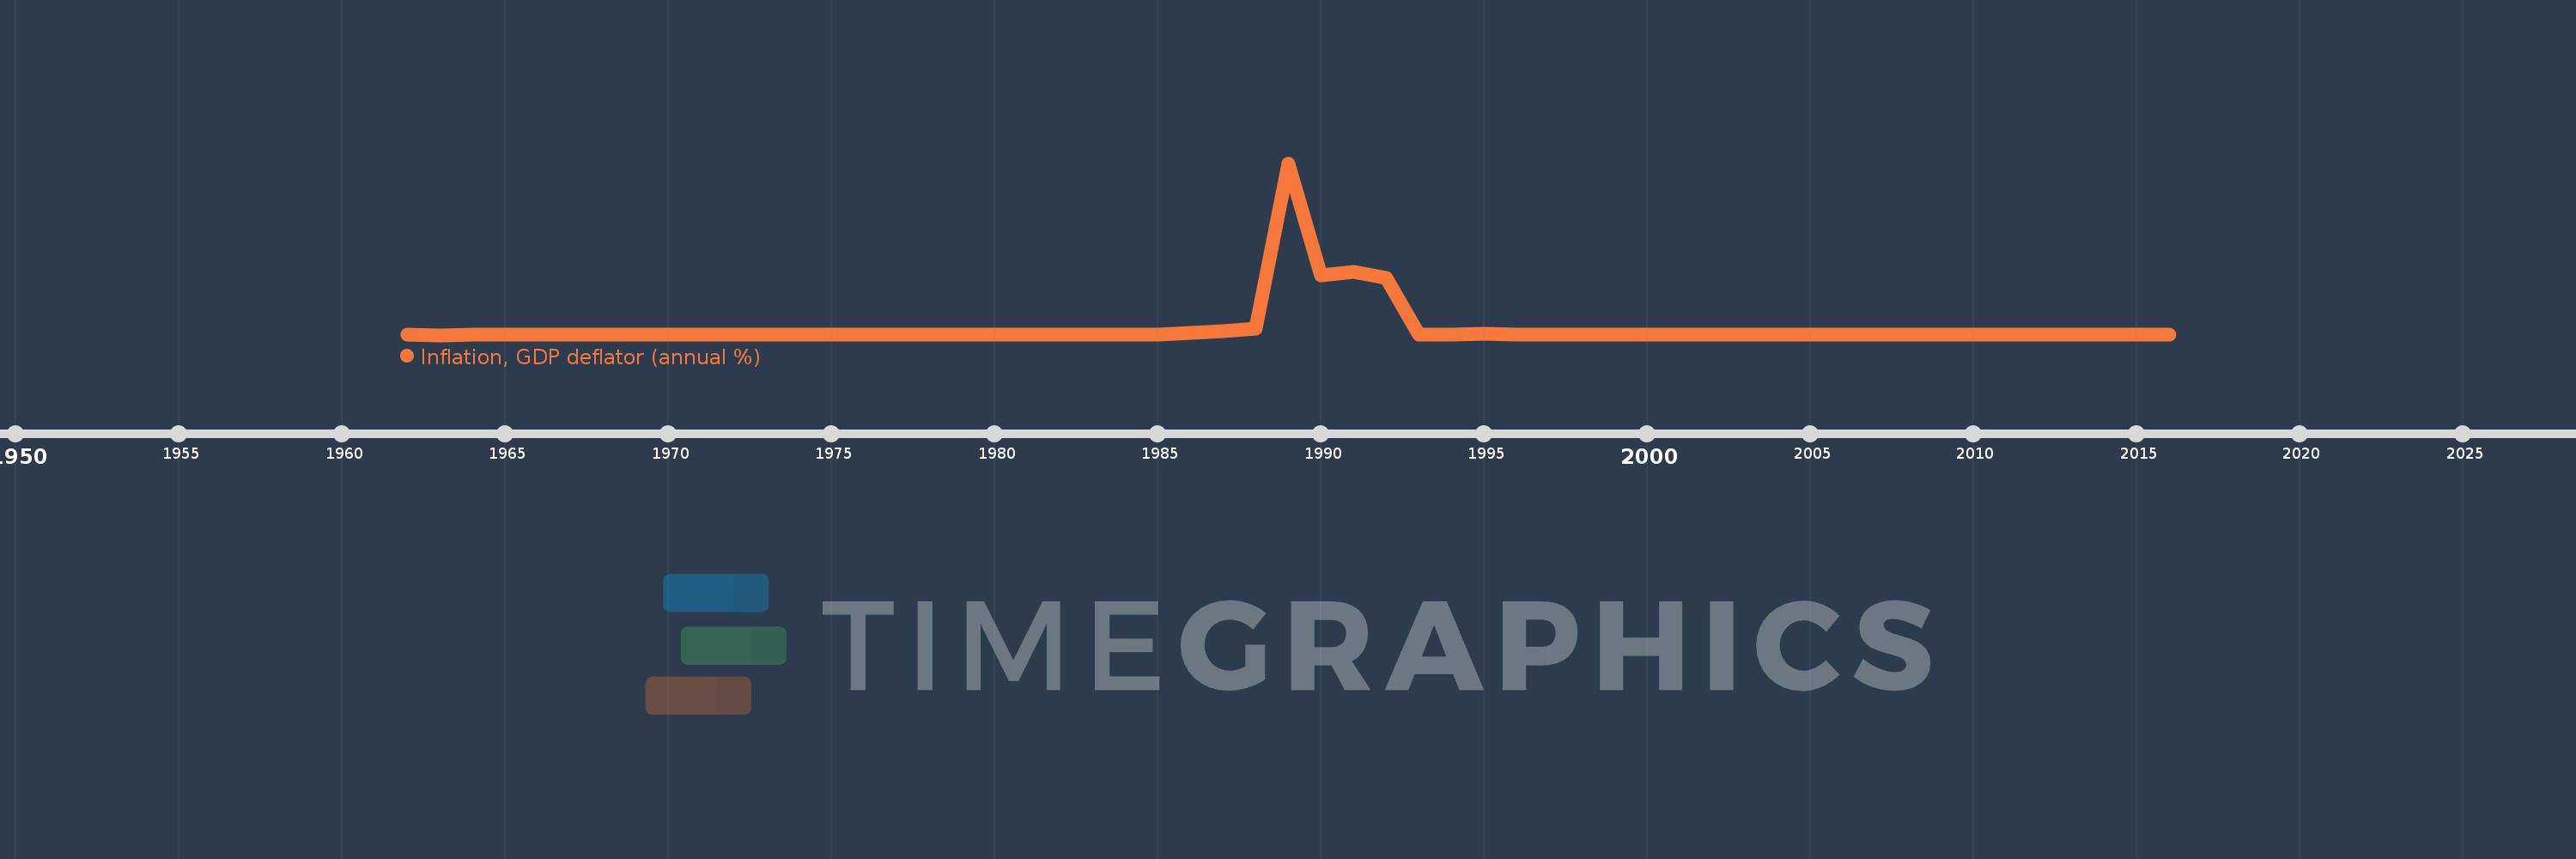
En esta escala de tiempo se presenta un gráfico de 1962 y 2016 de Nicaragua. Los datos de 1961 están ausentes. El número de observaciones reales por fecha: 55.
Fuente (nombre):
Indicadores del desarrollo mundial
Fuente (organización):
World Bank national accounts data, and OECD National Accounts data files.
Categorías:
Economy & Growth
Se ha actualizado:
23 abr 2017 año
Los indicadores de los cambios de valor en los últimos años
Mínimo:
-1.252
1 ene 1963 año
Máximo:
13.612 mil
1 ene 1989 año
A la fecha de observación
Valor
Cambio absoluto
El cambio con respecto al valor anterior
1 ene 1962 año
0.043
+0.043
0.0%
1 ene 1963 año
-1.252
-1.295
-2.98 mil%
1 ene 1964 año
0.427
+1.679
-134.13%
1 ene 1965 año
5.073
+4.646
1.09 mil%
1 ene 1966 año
1.323
-3.75
-73.93%
1 ene 1967 año
3.661
+2.338
176.78%
1 ene 1968 año
1.266
-2.395
-65.41%
1 ene 1969 año
4.49
+3.224
254.56%
1 ene 1970 año
1.172
-3.318
-73.9%
1 ene 1971 año
2.439
+1.267
108.12%
1 ene 1972 año
3.032
+0.593
24.31%
1 ene 1973 año
4.251
+1.219
40.21%
1 ene 1974 año
16.664
+12.413
292.03%
1 ene 1975 año
21.791
+5.127
30.77%
1 ene 1976 año
4.732
-17.059
-78.28%
1 ene 1977 año
10.434
+5.702
120.5%
1 ene 1978 año
11.852
+1.418
13.59%
1 ene 1979 año
3.771
-8.081
-68.18%
1 ene 1980 año
31.658
+27.887
739.47%
1 ene 1981 año
36.979
+5.32
16.8%
1 ene 1982 año
11.721
-25.258
-68.3%
1 ene 1983 año
16.746
+5.025
42.87%
1 ene 1984 año
11.002
-5.744
-34.3%
1 ene 1985 año
38.962
+27.96
254.14%
1 ene 1986 año
167.189
+128.227
329.11%
1 ene 1987 año
281.46
+114.271
68.35%
1 ene 1988 año
523.081
+241.621
85.85%
1 ene 1989 año
13.612 mil
+13.089 mil
2.5 mil%
1 ene 1990 año
4.709 mil
-8.902 mil
-65.4%
1 ene 1991 año
5.018 mil
+309.003
6.56%
1 ene 1992 año
4.524 mil
-494.487
-9.85%
1 ene 1993 año
23.666
-4.5 mil
-99.48%
1 ene 1994 año
20.389
-3.277
-13.85%
1 ene 1995 año
133.705
+113.316
555.76%
1 ene 1996 año
13.393
-120.312
-89.98%
1 ene 1997 año
9.607
-3.786
-28.27%
1 ene 1998 año
9.778
+0.171
1.78%
1 ene 1999 año
14.028
+4.25
43.47%
1 ene 2000 año
9.226
-4.802
-34.23%
1 ene 2001 año
8.566
-0.66
-7.15%
1 ene 2002 año
7.242
-1.325
-15.46%
1 ene 2003 año
3.248
-3.993
-55.14%
1 ene 2004 año
5.331
+2.083
64.12%
1 ene 2005 año
9.051
+3.72
69.78%
1 ene 2006 año
9.867
+0.816
9.02%
1 ene 2007 año
8.23
-1.637
-16.6%
1 ene 2008 año
9.599
+1.37
16.64%
1 ene 2009 año
16.238
+6.639
69.17%
1 ene 2010 año
6.567
-9.671
-59.56%
1 ene 2011 año
6.13
-0.437
-6.65%
1 ene 2012 año
10.31
+4.18
68.18%
1 ene 2013 año
6.41
-3.9
-37.83%
1 ene 2014 año
4.636
-1.775
-27.68%
1 ene 2015 año
8.869
+4.233
91.33%
1 ene 2016 año
7.726
-1.143
-12.89%
Ranking de los países por los datos estadísticos actuales


Comentarios: