29
/es/
es
AIzaSyAYiBZKx7MnpbEhh9jyipgxe19OcubqV5w
April 1, 2024
115919
Cuba
CUB
true
2
1
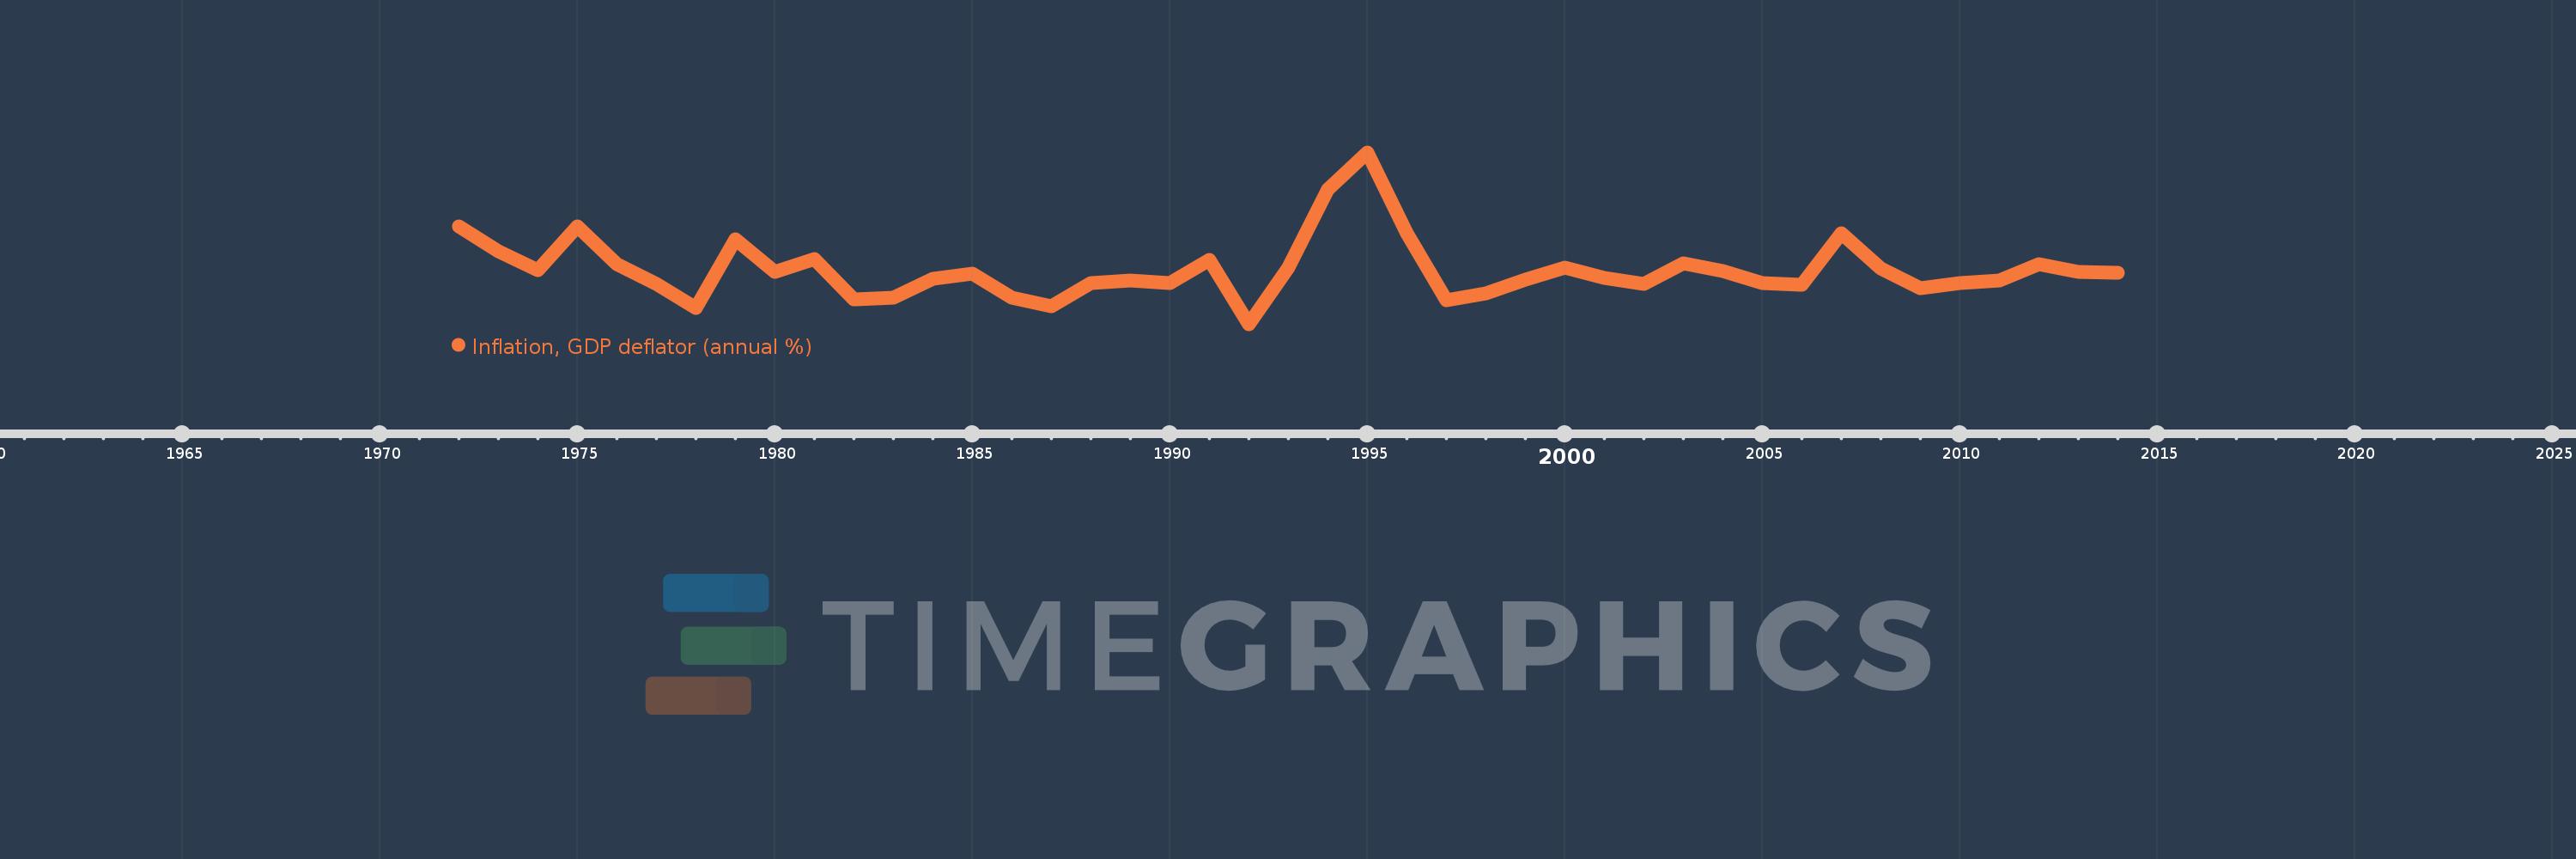
Inflation, GDP deflator (annual %)
2014,2013,2012,2011,2010,2009,2008,2007,2006,2005,2004,2003,2002,2001,2000,1999,1998,1997,1996,1995,1994,1993,1992,1991,1990,1989,1988,1987,1986,1985,1984,1983,1982,1981,1980,1979,1978,1977,1976,1975,1974,1973,1972
Estas estadísticas en otros países:
AfghanistanAlbaniaAlgeriaAndorraAngolaAntigua and BarbudaArab WorldArgentinaArmeniaArubaAustraliaAustriaAzerbaijanBahamas, TheBahrainBangladeshBarbadosBelarusBelgiumBelizeBeninBermudaBhutanBoliviaBosnia and HerzegovinaBotswanaBrazilBrunei DarussalamBulgariaBurkina FasoBurundiCabo VerdeCambodiaCameroonCanadaCaribbean small statesCayman IslandsCentral African RepublicCentral Europe and the BalticsChadChannel IslandsChileChinaColombiaComorosCongo, Dem. Rep.Congo, Rep.Costa RicaCote d'IvoireCroatiaCubaCyprusCzech RepublicDenmarkDjiboutiDominicaDominican RepublicEarly-demographic dividendEast Asia & PacificEast Asia & Pacific (excluding high income)East Asia & Pacific (IDA & IBRD countries)EcuadorEgypt, Arab Rep.El SalvadorEquatorial GuineaEritreaEstoniaEthiopiaEuro areaEurope & Central AsiaEurope & Central Asia (excluding high income)Europe & Central Asia (IDA & IBRD countries)European UnionFijiFinlandFragile and conflict affected situationsFranceFrench PolynesiaGabonGambia, TheGeorgiaGermanyGhanaGreeceGreenlandGrenadaGuatemalaGuineaGuinea-BissauGuyanaHaitiHeavily indebted poor countries (HIPC)High incomeHondurasHong Kong SAR, ChinaHungaryIBRD onlyIcelandIDA & IBRD totalIDA blendIDA onlyIDA totalIndiaIndonesiaIran, Islamic Rep.IraqIrelandIsle of ManIsraelItalyJamaicaJapanJordanKazakhstanKenyaKiribatiKorea, Rep.KosovoKuwaitKyrgyz RepublicLao PDRLate-demographic dividendLatin America & Caribbean Latin America & Caribbean (excluding high income)Latin America & the Caribbean (IDA & IBRD countries)LatviaLeast developed countries: UN classificationLebanonLesothoLiberiaLibyaLiechtensteinLithuaniaLow & middle incomeLow incomeLower middle incomeLuxembourgMacao SAR, ChinaMacedonia, FYRMadagascarMalawiMalaysiaMaldivesMaliMaltaMarshall IslandsMauritaniaMauritiusMexicoMicronesia, Fed. Sts.Middle East & North AfricaMiddle East & North Africa (excluding high income)Middle East & North Africa (IDA & IBRD countries)Middle incomeMoldovaMonacoMongoliaMontenegroMoroccoMozambiqueMyanmarNamibiaNauruNepalNetherlandsNew CaledoniaNew ZealandNicaraguaNigerNigeriaNorth AmericaNorwayOECD membersOmanOther small statesPacific island small statesPakistanPalauPanamaPapua New GuineaParaguayPeruPhilippinesPolandPortugalPost-demographic dividendPre-demographic dividendPuerto RicoQatarRomaniaRussian FederationRwandaSamoaSan MarinoSao Tome and PrincipeSaudi ArabiaSenegalSerbiaSeychellesSierra LeoneSingaporeSlovak RepublicSloveniaSmall statesSolomon IslandsSomaliaSouth AfricaSouth AsiaSouth Asia (IDA & IBRD)South SudanSpainSri LankaSt. Kitts and NevisSt. LuciaSt. Vincent and the GrenadinesSub-Saharan Africa Sub-Saharan Africa (excluding high income)Sub-Saharan Africa (IDA & IBRD countries)SudanSurinameSwazilandSwedenSwitzerlandSyrian Arab RepublicTajikistanTanzaniaThailandTimor-LesteTogoTongaTrinidad and TobagoTunisiaTurkeyTurkmenistanTuvaluUgandaUkraineUnited Arab EmiratesUnited KingdomUnited StatesUpper middle incomeUruguayUzbekistanVanuatuVenezuela, RBVietnamVirgin Islands (U.S.)West Bank and GazaWorldYemen, Rep.ZambiaZimbabwe línea de tiempo (timeline):
En esta escala de tiempo se presenta un gráfico de 1972 y 2014 de Cuba. Los datos de 1971 están ausentes. El número de observaciones reales por fecha: 43.
Fuente (nombre):
Indicadores del desarrollo mundial
Fuente (organización):
World Bank national accounts data, and OECD National Accounts data files.
Categorías:
Economy & Growth
Se ha actualizado:
23 abr 2017 año
Los indicadores de los cambios de valor en los últimos años
Mínimo:
-7.388
1 ene 1992 año
Máximo:
26.282
1 ene 1995 año
A la fecha de observación
Valor
Cambio absoluto
El cambio con respecto al valor anterior
1 ene 1972 año
11.857
+11.857
0.0%
1 ene 1973 año
6.959
-4.899
-41.31%
1 ene 1974 año
3.252
-3.707
-53.27%
1 ene 1975 año
11.859
+8.607
264.72%
1 ene 1976 año
4.329
-7.53
-63.49%
1 ene 1977 año
0.523
-3.806
-87.91%
1 ene 1978 año
-4.194
-4.717
-901.6%
1 ene 1979 año
9.321
+13.515
-322.26%
1 ene 1980 año
2.928
-6.393
-68.59%
1 ene 1981 año
5.395
+2.467
84.27%
1 ene 1982 año
-2.537
-7.932
-147.02%
1 ene 1983 año
-2.228
+0.309
-12.2%
1 ene 1984 año
1.597
+3.824
-171.68%
1 ene 1985 año
2.584
+0.988
61.87%
1 ene 1986 año
-2.158
-4.742
-183.48%
1 ene 1987 año
-3.914
-1.757
81.41%
1 ene 1988 año
0.61
+4.525
-115.6%
1 ene 1989 año
1.233
+0.623
102.01%
1 ene 1990 año
0.625
-0.608
-49.33%
1 ene 1991 año
5.261
+4.636
742.01%
1 ene 1992 año
-7.388
-12.649
-240.42%
1 ene 1993 año
3.746
+11.134
-150.7%
1 ene 1994 año
18.975
+15.23
406.59%
1 ene 1995 año
26.282
+7.307
38.51%
1 ene 1996 año
10.509
-15.773
-60.02%
1 ene 1997 año
-2.672
-13.181
-125.43%
1 ene 1998 año
-1.353
+1.319
-49.37%
1 ene 1999 año
1.302
+2.655
-196.29%
1 ene 2000 año
3.788
+2.486
190.84%
1 ene 2001 año
1.737
-2.051
-54.15%
1 ene 2002 año
0.461
-1.276
-73.45%
1 ene 2003 año
4.526
+4.065
881.41%
1 ene 2004 año
2.976
-1.55
-34.25%
1 ene 2005 año
0.604
-2.372
-79.69%
1 ene 2006 año
0.381
-0.223
-36.88%
1 ene 2007 año
10.363
+9.982
2.62 mil%
1 ene 2008 año
3.59
-6.773
-65.35%
1 ene 2009 año
-0.344
-3.934
-109.58%
1 ene 2010 año
0.634
+0.978
-284.4%
1 ene 2011 año
1.207
+0.573
90.3%
1 ene 2012 año
4.323
+3.116
258.27%
1 ene 2013 año
2.912
-1.411
-32.65%
1 ene 2014 año
2.724
-0.187
-6.43%
Ranking de los países por los datos estadísticos actuales


Comentarios: