29
/es/
es
AIzaSyAYiBZKx7MnpbEhh9jyipgxe19OcubqV5w
April 1, 2024
201725
Morocco
MAR
true
2
1
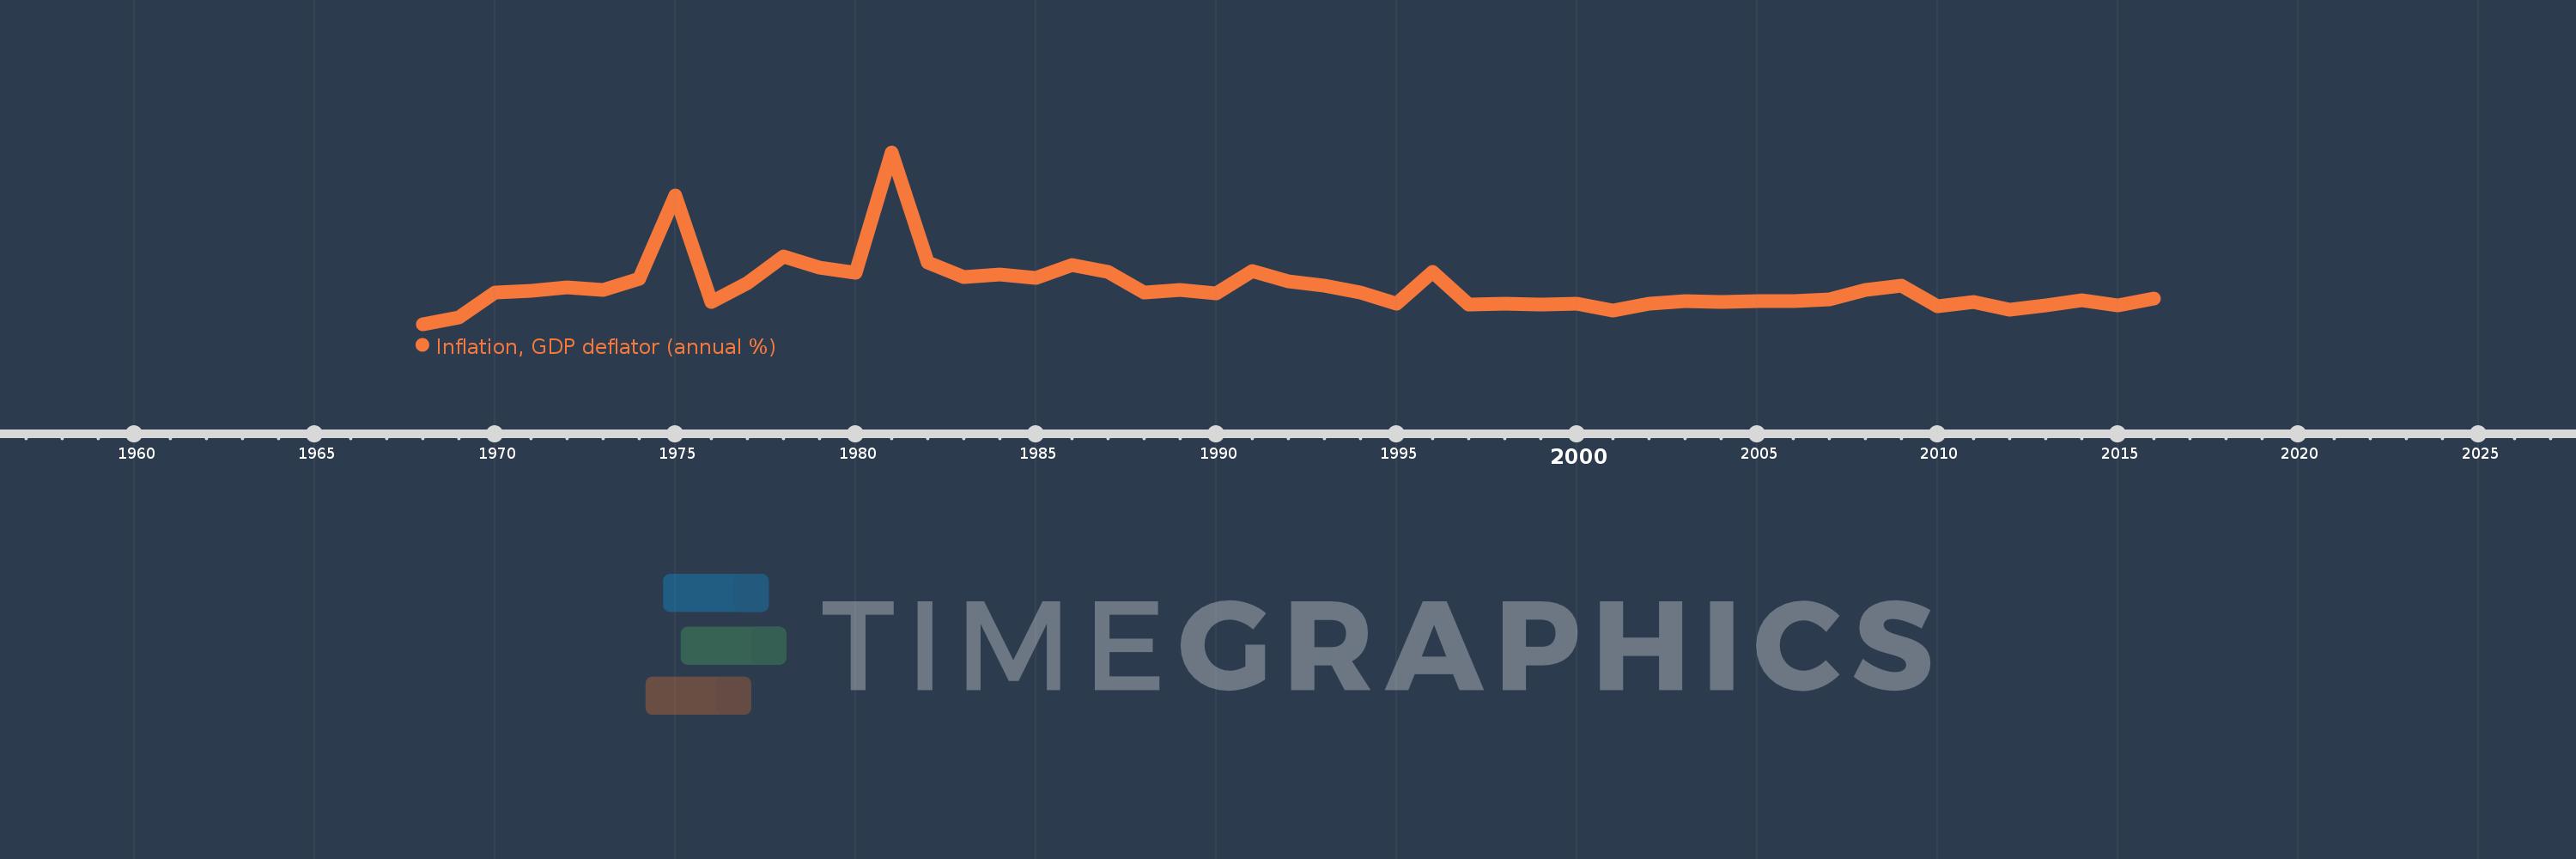
Inflation, GDP deflator (annual %)
2016,2015,2014,2013,2012,2011,2010,2009,2008,2007,2006,2005,2004,2003,2002,2001,2000,1999,1998,1997,1996,1995,1994,1993,1992,1991,1990,1989,1988,1987,1986,1985,1984,1983,1982,1981,1980,1979,1978,1977,1976,1975,1974,1973,1972,1971,1970,1969,1968
Estas estadísticas en otros países:
AfghanistanAlbaniaAlgeriaAndorraAngolaAntigua and BarbudaArab WorldArgentinaArmeniaArubaAustraliaAustriaAzerbaijanBahamas, TheBahrainBangladeshBarbadosBelarusBelgiumBelizeBeninBermudaBhutanBoliviaBosnia and HerzegovinaBotswanaBrazilBrunei DarussalamBulgariaBurkina FasoBurundiCabo VerdeCambodiaCameroonCanadaCaribbean small statesCayman IslandsCentral African RepublicCentral Europe and the BalticsChadChannel IslandsChileChinaColombiaComorosCongo, Dem. Rep.Congo, Rep.Costa RicaCote d'IvoireCroatiaCubaCyprusCzech RepublicDenmarkDjiboutiDominicaDominican RepublicEarly-demographic dividendEast Asia & PacificEast Asia & Pacific (excluding high income)East Asia & Pacific (IDA & IBRD countries)EcuadorEgypt, Arab Rep.El SalvadorEquatorial GuineaEritreaEstoniaEthiopiaEuro areaEurope & Central AsiaEurope & Central Asia (excluding high income)Europe & Central Asia (IDA & IBRD countries)European UnionFijiFinlandFragile and conflict affected situationsFranceFrench PolynesiaGabonGambia, TheGeorgiaGermanyGhanaGreeceGreenlandGrenadaGuatemalaGuineaGuinea-BissauGuyanaHaitiHeavily indebted poor countries (HIPC)High incomeHondurasHong Kong SAR, ChinaHungaryIBRD onlyIcelandIDA & IBRD totalIDA blendIDA onlyIDA totalIndiaIndonesiaIran, Islamic Rep.IraqIrelandIsle of ManIsraelItalyJamaicaJapanJordanKazakhstanKenyaKiribatiKorea, Rep.KosovoKuwaitKyrgyz RepublicLao PDRLate-demographic dividendLatin America & Caribbean Latin America & Caribbean (excluding high income)Latin America & the Caribbean (IDA & IBRD countries)LatviaLeast developed countries: UN classificationLebanonLesothoLiberiaLibyaLiechtensteinLithuaniaLow & middle incomeLow incomeLower middle incomeLuxembourgMacao SAR, ChinaMacedonia, FYRMadagascarMalawiMalaysiaMaldivesMaliMaltaMarshall IslandsMauritaniaMauritiusMexicoMicronesia, Fed. Sts.Middle East & North AfricaMiddle East & North Africa (excluding high income)Middle East & North Africa (IDA & IBRD countries)Middle incomeMoldovaMonacoMongoliaMontenegroMoroccoMozambiqueMyanmarNamibiaNauruNepalNetherlandsNew CaledoniaNew ZealandNicaraguaNigerNigeriaNorth AmericaNorwayOECD membersOmanOther small statesPacific island small statesPakistanPalauPanamaPapua New GuineaParaguayPeruPhilippinesPolandPortugalPost-demographic dividendPre-demographic dividendPuerto RicoQatarRomaniaRussian FederationRwandaSamoaSan MarinoSao Tome and PrincipeSaudi ArabiaSenegalSerbiaSeychellesSierra LeoneSingaporeSlovak RepublicSloveniaSmall statesSolomon IslandsSomaliaSouth AfricaSouth AsiaSouth Asia (IDA & IBRD)South SudanSpainSri LankaSt. Kitts and NevisSt. LuciaSt. Vincent and the GrenadinesSub-Saharan Africa Sub-Saharan Africa (excluding high income)Sub-Saharan Africa (IDA & IBRD countries)SudanSurinameSwazilandSwedenSwitzerlandSyrian Arab RepublicTajikistanTanzaniaThailandTimor-LesteTogoTongaTrinidad and TobagoTunisiaTurkeyTurkmenistanTuvaluUgandaUkraineUnited Arab EmiratesUnited KingdomUnited StatesUpper middle incomeUruguayUzbekistanVanuatuVenezuela, RBVietnamVirgin Islands (U.S.)West Bank and GazaWorldYemen, Rep.ZambiaZimbabwe línea de tiempo (timeline):
En esta escala de tiempo se presenta un gráfico de 1968 y 2016 de Morocco. Los datos de 1967 están ausentes. El número de observaciones reales por fecha: 49.
Fuente (nombre):
Indicadores del desarrollo mundial
Fuente (organización):
World Bank national accounts data, and OECD National Accounts data files.
Categorías:
Economy & Growth
Se ha actualizado:
23 abr 2017 año
Los indicadores de los cambios de valor en los últimos años
Mínimo:
-3.745
1 ene 1968 año
Máximo:
33.023
1 ene 1981 año
A la fecha de observación
Valor
Cambio absoluto
El cambio con respecto al valor anterior
1 ene 1968 año
-3.745
-3.745
0.0%
1 ene 1969 año
-2.278
+1.467
-39.17%
1 ene 1970 año
3.008
+5.286
-232.05%
1 ene 1971 año
3.468
+0.46
15.28%
1 ene 1972 año
4.065
+0.597
17.23%
1 ene 1973 año
3.584
-0.481
-11.83%
1 ene 1974 año
6.039
+2.455
68.5%
1 ene 1975 año
23.898
+17.859
295.71%
1 ene 1976 año
0.931
-22.967
-96.1%
1 ene 1977 año
4.977
+4.045
434.36%
1 ene 1978 año
10.771
+5.794
116.43%
1 ene 1979 año
8.417
-2.354
-21.85%
1 ene 1980 año
7.345
-1.073
-12.74%
1 ene 1981 año
33.023
+25.679
349.62%
1 ene 1982 año
9.47
-23.553
-71.32%
1 ene 1983 año
6.298
-3.172
-33.49%
1 ene 1984 año
6.97
+0.672
10.67%
1 ene 1985 año
6.201
-0.769
-11.03%
1 ene 1986 año
8.954
+2.752
44.39%
1 ene 1987 año
7.491
-1.463
-16.34%
1 ene 1988 año
3.015
-4.476
-59.75%
1 ene 1989 año
3.671
+0.656
21.75%
1 ene 1990 año
2.92
-0.751
-20.45%
1 ene 1991 año
7.694
+4.774
163.51%
1 ene 1992 año
5.396
-2.298
-29.87%
1 ene 1993 año
4.588
-0.808
-14.98%
1 ene 1994 año
3.035
-1.553
-33.85%
1 ene 1995 año
0.655
-2.38
-78.41%
1 ene 1996 año
7.538
+6.883
1.05 mil%
1 ene 1997 año
0.435
-7.103
-94.22%
1 ene 1998 año
0.713
+0.278
63.81%
1 ene 1999 año
0.391
-0.322
-45.15%
1 ene 2000 año
0.57
+0.178
45.54%
1 ene 2001 año
-0.742
-1.312
-230.33%
1 ene 2002 año
0.652
+1.395
-187.88%
1 ene 2003 año
1.209
+0.556
85.27%
1 ene 2004 año
1.063
-0.146
-12.08%
1 ene 2005 año
1.219
+0.157
14.74%
1 ene 2006 año
1.191
-0.029
-2.35%
1 ene 2007 año
1.548
+0.357
30.03%
1 ene 2008 año
3.595
+2.047
132.23%
1 ene 2009 año
4.53
+0.935
26.02%
1 ene 2010 año
0.147
-4.384
-96.76%
1 ene 2011 año
0.976
+0.829
564.08%
1 ene 2012 año
-0.691
-1.667
-170.82%
1 ene 2013 año
0.369
+1.06
-153.45%
1 ene 2014 año
1.307
+0.938
253.95%
1 ene 2015 año
0.311
-0.996
-76.19%
1 ene 2016 año
1.749
+1.438
461.78%
Ranking de los países por los datos estadísticos actuales


Comentarios: