29
/es/
es
AIzaSyAYiBZKx7MnpbEhh9jyipgxe19OcubqV5w
April 1, 2024
168735
Kiribati
KIR
true
2
1
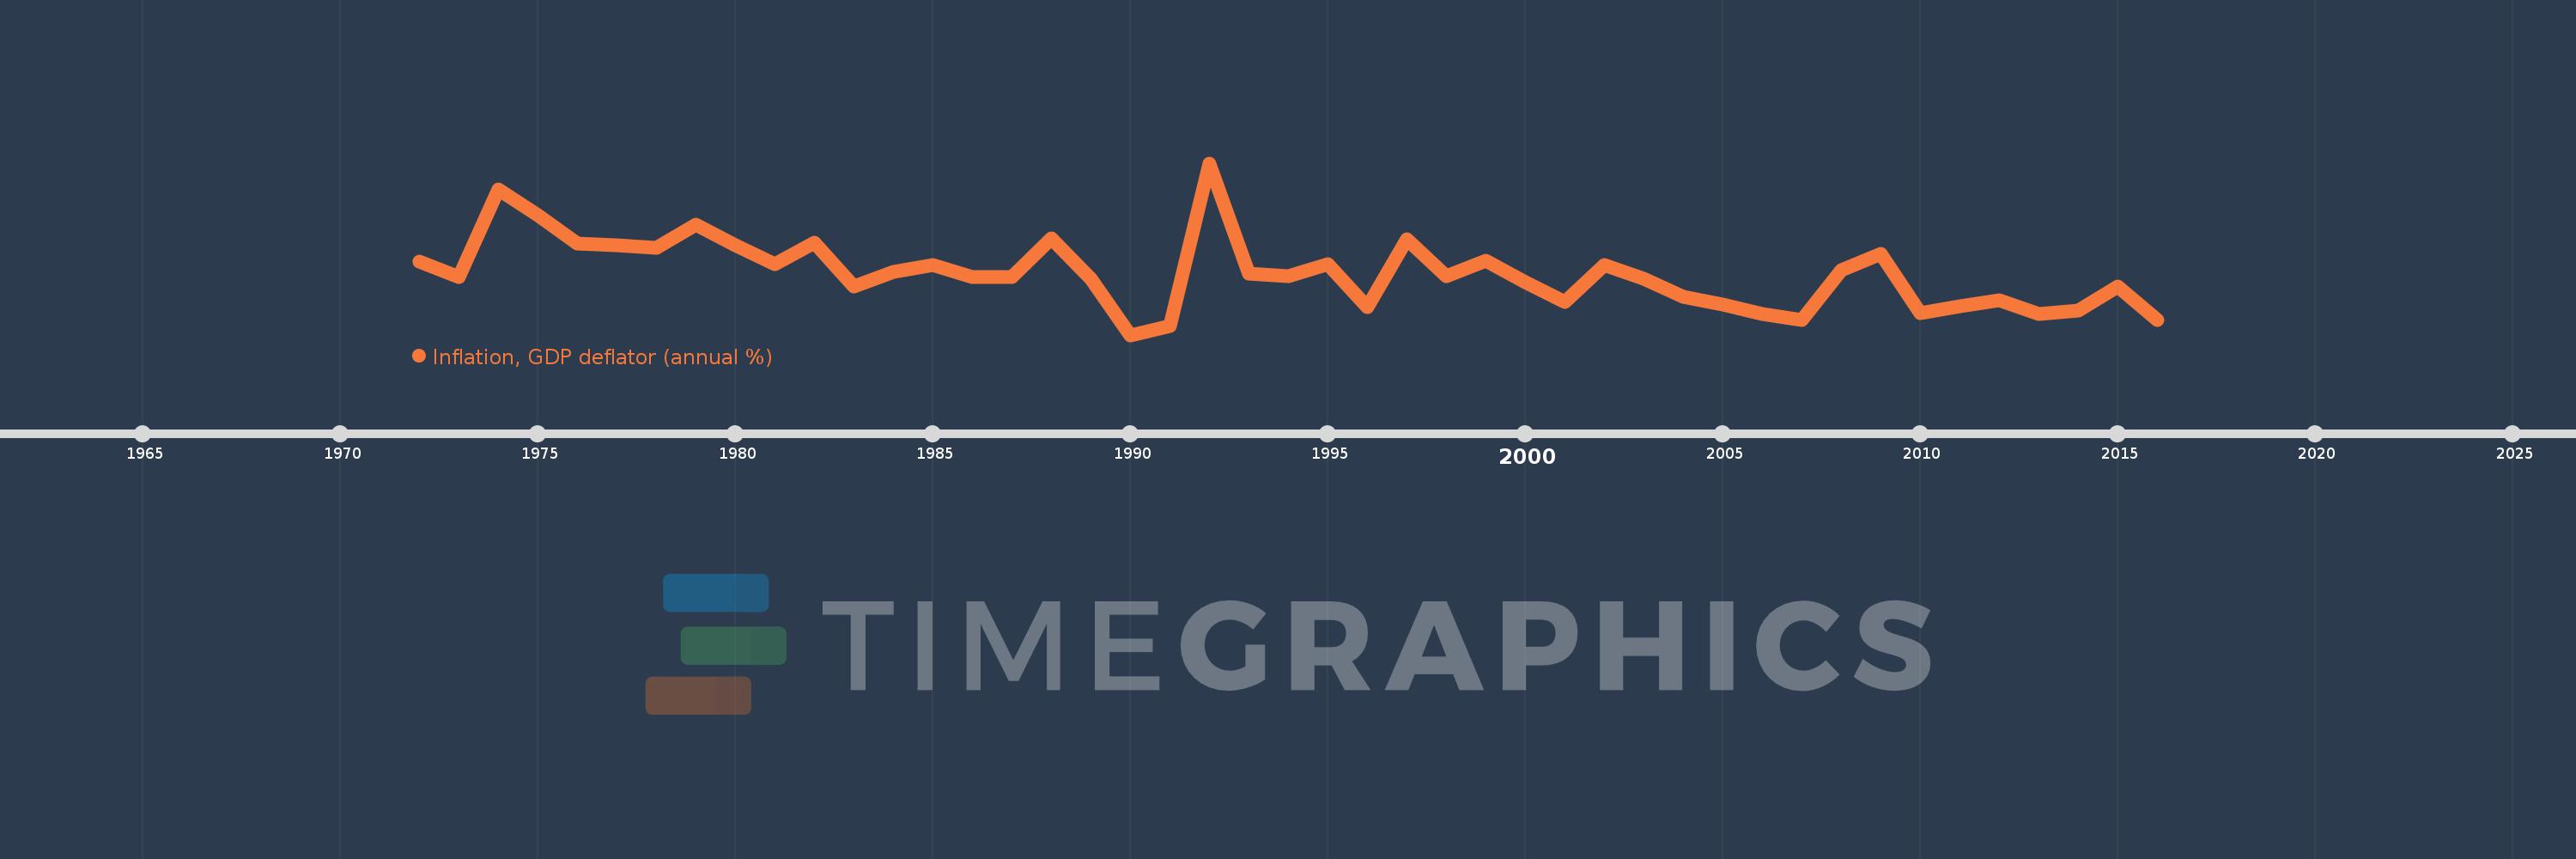
Inflation, GDP deflator (annual %)
2016,2015,2014,2013,2012,2011,2010,2009,2008,2007,2006,2005,2004,2003,2002,2001,2000,1999,1998,1997,1996,1995,1994,1993,1992,1991,1990,1989,1988,1987,1986,1985,1984,1983,1982,1981,1980,1979,1978,1977,1976,1975,1974,1973,1972
Estas estadísticas en otros países:
AfghanistanAlbaniaAlgeriaAndorraAngolaAntigua and BarbudaArab WorldArgentinaArmeniaArubaAustraliaAustriaAzerbaijanBahamas, TheBahrainBangladeshBarbadosBelarusBelgiumBelizeBeninBermudaBhutanBoliviaBosnia and HerzegovinaBotswanaBrazilBrunei DarussalamBulgariaBurkina FasoBurundiCabo VerdeCambodiaCameroonCanadaCaribbean small statesCayman IslandsCentral African RepublicCentral Europe and the BalticsChadChannel IslandsChileChinaColombiaComorosCongo, Dem. Rep.Congo, Rep.Costa RicaCote d'IvoireCroatiaCubaCyprusCzech RepublicDenmarkDjiboutiDominicaDominican RepublicEarly-demographic dividendEast Asia & PacificEast Asia & Pacific (excluding high income)East Asia & Pacific (IDA & IBRD countries)EcuadorEgypt, Arab Rep.El SalvadorEquatorial GuineaEritreaEstoniaEthiopiaEuro areaEurope & Central AsiaEurope & Central Asia (excluding high income)Europe & Central Asia (IDA & IBRD countries)European UnionFijiFinlandFragile and conflict affected situationsFranceFrench PolynesiaGabonGambia, TheGeorgiaGermanyGhanaGreeceGreenlandGrenadaGuatemalaGuineaGuinea-BissauGuyanaHaitiHeavily indebted poor countries (HIPC)High incomeHondurasHong Kong SAR, ChinaHungaryIBRD onlyIcelandIDA & IBRD totalIDA blendIDA onlyIDA totalIndiaIndonesiaIran, Islamic Rep.IraqIrelandIsle of ManIsraelItalyJamaicaJapanJordanKazakhstanKenyaKiribatiKorea, Rep.KosovoKuwaitKyrgyz RepublicLao PDRLate-demographic dividendLatin America & Caribbean Latin America & Caribbean (excluding high income)Latin America & the Caribbean (IDA & IBRD countries)LatviaLeast developed countries: UN classificationLebanonLesothoLiberiaLibyaLiechtensteinLithuaniaLow & middle incomeLow incomeLower middle incomeLuxembourgMacao SAR, ChinaMacedonia, FYRMadagascarMalawiMalaysiaMaldivesMaliMaltaMarshall IslandsMauritaniaMauritiusMexicoMicronesia, Fed. Sts.Middle East & North AfricaMiddle East & North Africa (excluding high income)Middle East & North Africa (IDA & IBRD countries)Middle incomeMoldovaMonacoMongoliaMontenegroMoroccoMozambiqueMyanmarNamibiaNauruNepalNetherlandsNew CaledoniaNew ZealandNicaraguaNigerNigeriaNorth AmericaNorwayOECD membersOmanOther small statesPacific island small statesPakistanPalauPanamaPapua New GuineaParaguayPeruPhilippinesPolandPortugalPost-demographic dividendPre-demographic dividendPuerto RicoQatarRomaniaRussian FederationRwandaSamoaSan MarinoSao Tome and PrincipeSaudi ArabiaSenegalSerbiaSeychellesSierra LeoneSingaporeSlovak RepublicSloveniaSmall statesSolomon IslandsSomaliaSouth AfricaSouth AsiaSouth Asia (IDA & IBRD)South SudanSpainSri LankaSt. Kitts and NevisSt. LuciaSt. Vincent and the GrenadinesSub-Saharan Africa Sub-Saharan Africa (excluding high income)Sub-Saharan Africa (IDA & IBRD countries)SudanSurinameSwazilandSwedenSwitzerlandSyrian Arab RepublicTajikistanTanzaniaThailandTimor-LesteTogoTongaTrinidad and TobagoTunisiaTurkeyTurkmenistanTuvaluUgandaUkraineUnited Arab EmiratesUnited KingdomUnited StatesUpper middle incomeUruguayUzbekistanVanuatuVenezuela, RBVietnamVirgin Islands (U.S.)West Bank and GazaWorldYemen, Rep.ZambiaZimbabwe línea de tiempo (timeline):
En esta escala de tiempo se presenta un gráfico de 1972 y 2016 de Kiribati. Los datos de 1971 están ausentes. El número de observaciones reales por fecha: 45.
Fuente (nombre):
Indicadores del desarrollo mundial
Fuente (organización):
World Bank national accounts data, and OECD National Accounts data files.
Categorías:
Economy & Growth
Se ha actualizado:
23 abr 2017 año
Los indicadores de los cambios de valor en los últimos años
Mínimo:
-2.166
1 ene 1990 año
Máximo:
19.608
1 ene 1992 año
A la fecha de observación
Valor
Cambio absoluto
El cambio con respecto al valor anterior
1 ene 1972 año
7.113
+7.113
0.0%
1 ene 1973 año
5.228
-1.886
-26.51%
1 ene 1974 año
16.255
+11.028
210.95%
1 ene 1975 año
12.99
-3.266
-20.09%
1 ene 1976 año
9.461
-3.529
-27.17%
1 ene 1977 año
9.172
-0.289
-3.05%
1 ene 1978 año
8.896
-0.276
-3.01%
1 ene 1979 año
11.856
+2.96
33.27%
1 ene 1980 año
9.174
-2.682
-22.62%
1 ene 1981 año
6.804
-2.37
-25.83%
1 ene 1982 año
9.502
+2.698
39.65%
1 ene 1983 año
4.0
-5.502
-57.9%
1 ene 1984 año
5.847
+1.847
46.17%
1 ene 1985 año
6.74
+0.893
15.28%
1 ene 1986 año
5.152
-1.588
-23.56%
1 ene 1987 año
5.217
+0.065
1.27%
1 ene 1988 año
10.092
+4.874
93.43%
1 ene 1989 año
4.954
-5.137
-50.91%
1 ene 1990 año
-2.166
-7.12
-143.72%
1 ene 1991 año
-1.063
+1.103
-50.93%
1 ene 1992 año
19.608
+20.671
-1.95 mil%
1 ene 1993 año
5.631
-13.977
-71.28%
1 ene 1994 año
5.239
-0.392
-6.96%
1 ene 1995 año
6.853
+1.615
30.82%
1 ene 1996 año
1.333
-5.52
-80.54%
1 ene 1997 año
9.978
+8.645
648.36%
1 ene 1998 año
5.304
-4.674
-46.85%
1 ene 1999 año
7.253
+1.949
36.75%
1 ene 2000 año
4.492
-2.761
-38.06%
1 ene 2001 año
2.034
-2.458
-54.72%
1 ene 2002 año
6.742
+4.708
231.46%
1 ene 2003 año
4.947
-1.795
-26.62%
1 ene 2004 año
2.639
-2.308
-46.65%
1 ene 2005 año
1.708
-0.932
-35.3%
1 ene 2006 año
0.512
-1.196
-70.01%
1 ene 2007 año
-0.256
-0.768
-149.9%
1 ene 2008 año
6.07
+6.325
-2.48 mil%
1 ene 2009 año
8.141
+2.072
34.13%
1 ene 2010 año
0.563
-7.578
-93.08%
1 ene 2011 año
1.524
+0.961
170.54%
1 ene 2012 año
2.288
+0.764
50.14%
1 ene 2013 año
0.535
-1.753
-76.63%
1 ene 2014 año
0.905
+0.37
69.22%
1 ene 2015 año
3.979
+3.075
339.87%
1 ene 2016 año
-0.235
-4.215
-105.92%
Ranking de los países por los datos estadísticos actuales


Comentarios: