29
/es/
es
AIzaSyAYiBZKx7MnpbEhh9jyipgxe19OcubqV5w
April 1, 2024
146990
Guinea-Bissau
GNB
true
2
1
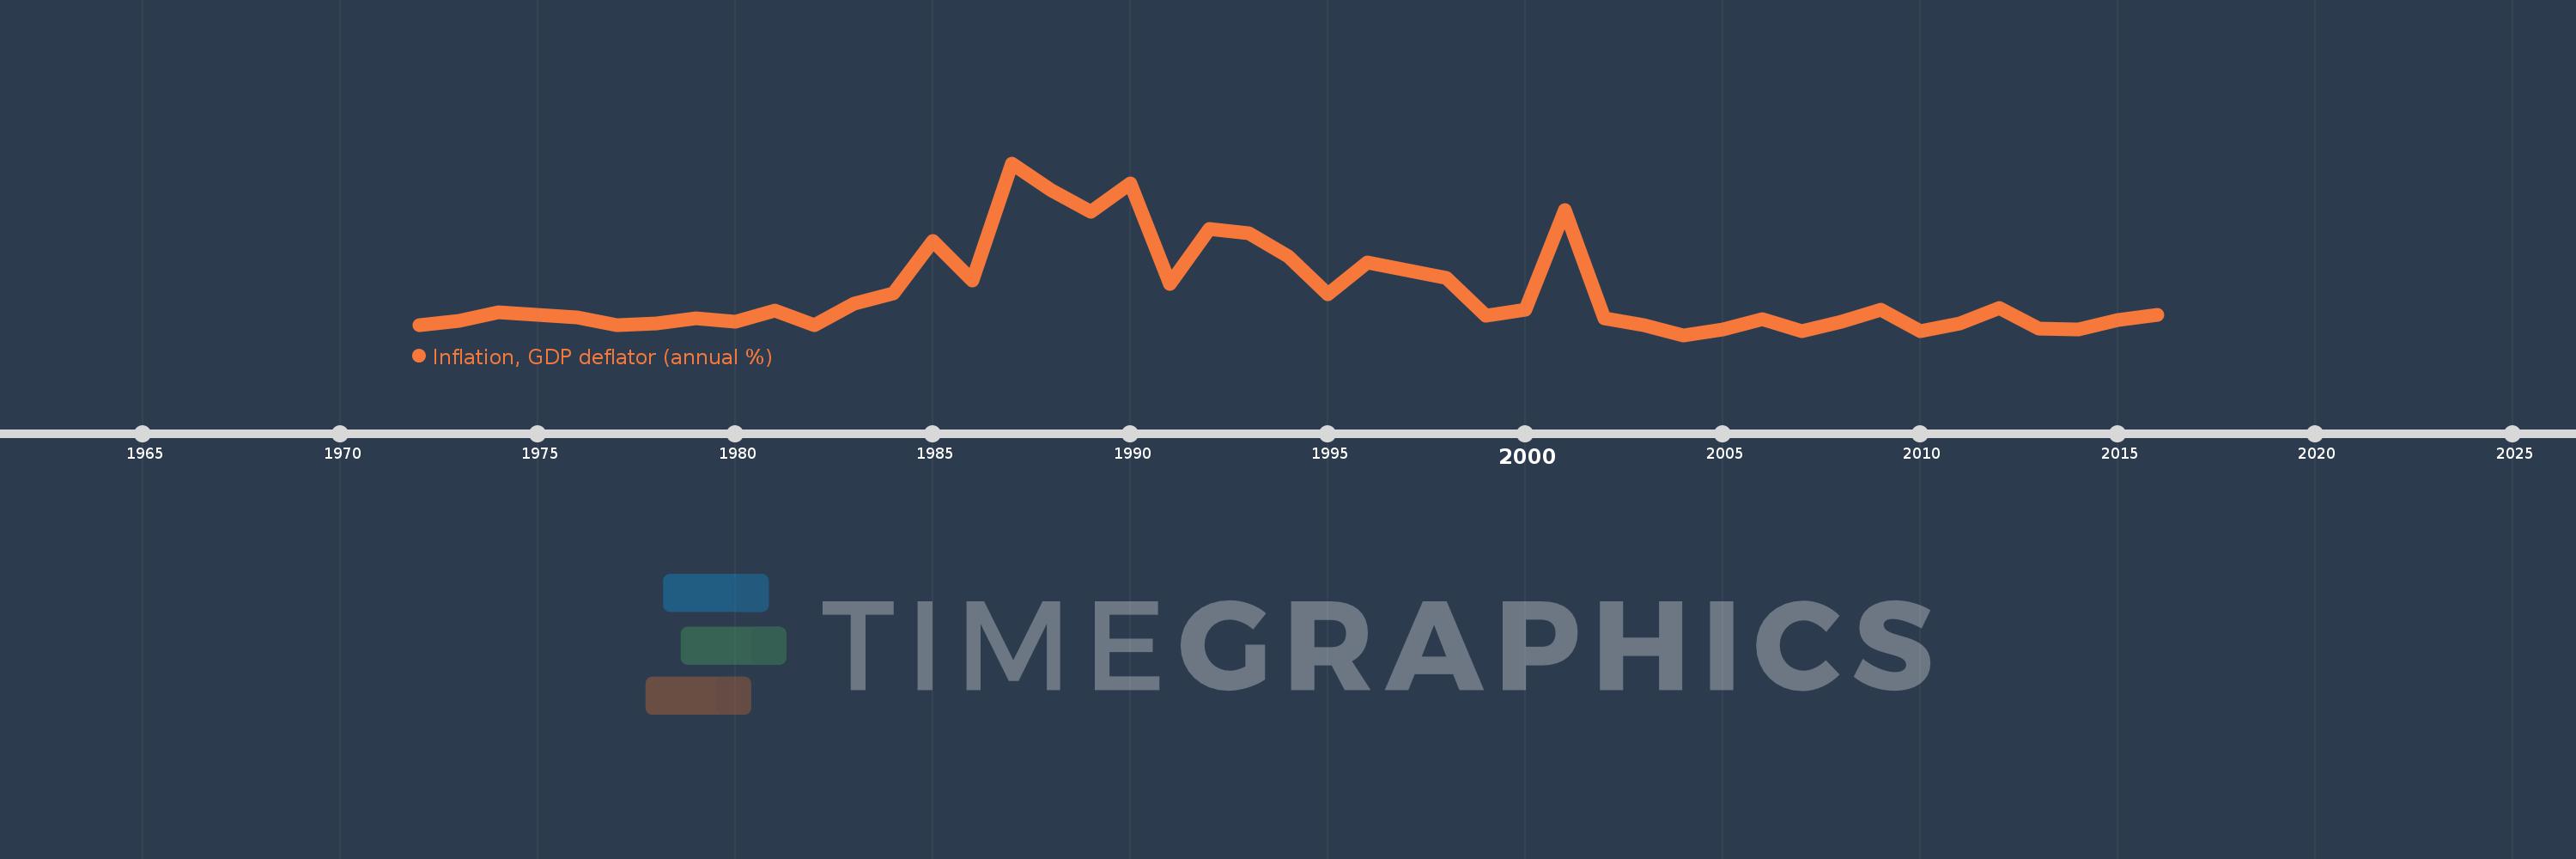
Inflation, GDP deflator (annual %)
2016,2015,2014,2013,2012,2011,2010,2009,2008,2007,2006,2005,2004,2003,2002,2001,2000,1999,1998,1997,1996,1995,1994,1993,1992,1991,1990,1989,1988,1987,1986,1985,1984,1983,1982,1981,1980,1979,1978,1977,1976,1975,1974,1973,1972
Estas estadísticas en otros países:
AfghanistanAlbaniaAlgeriaAndorraAngolaAntigua and BarbudaArab WorldArgentinaArmeniaArubaAustraliaAustriaAzerbaijanBahamas, TheBahrainBangladeshBarbadosBelarusBelgiumBelizeBeninBermudaBhutanBoliviaBosnia and HerzegovinaBotswanaBrazilBrunei DarussalamBulgariaBurkina FasoBurundiCabo VerdeCambodiaCameroonCanadaCaribbean small statesCayman IslandsCentral African RepublicCentral Europe and the BalticsChadChannel IslandsChileChinaColombiaComorosCongo, Dem. Rep.Congo, Rep.Costa RicaCote d'IvoireCroatiaCubaCyprusCzech RepublicDenmarkDjiboutiDominicaDominican RepublicEarly-demographic dividendEast Asia & PacificEast Asia & Pacific (excluding high income)East Asia & Pacific (IDA & IBRD countries)EcuadorEgypt, Arab Rep.El SalvadorEquatorial GuineaEritreaEstoniaEthiopiaEuro areaEurope & Central AsiaEurope & Central Asia (excluding high income)Europe & Central Asia (IDA & IBRD countries)European UnionFijiFinlandFragile and conflict affected situationsFranceFrench PolynesiaGabonGambia, TheGeorgiaGermanyGhanaGreeceGreenlandGrenadaGuatemalaGuineaGuinea-BissauGuyanaHaitiHeavily indebted poor countries (HIPC)High incomeHondurasHong Kong SAR, ChinaHungaryIBRD onlyIcelandIDA & IBRD totalIDA blendIDA onlyIDA totalIndiaIndonesiaIran, Islamic Rep.IraqIrelandIsle of ManIsraelItalyJamaicaJapanJordanKazakhstanKenyaKiribatiKorea, Rep.KosovoKuwaitKyrgyz RepublicLao PDRLate-demographic dividendLatin America & Caribbean Latin America & Caribbean (excluding high income)Latin America & the Caribbean (IDA & IBRD countries)LatviaLeast developed countries: UN classificationLebanonLesothoLiberiaLibyaLiechtensteinLithuaniaLow & middle incomeLow incomeLower middle incomeLuxembourgMacao SAR, ChinaMacedonia, FYRMadagascarMalawiMalaysiaMaldivesMaliMaltaMarshall IslandsMauritaniaMauritiusMexicoMicronesia, Fed. Sts.Middle East & North AfricaMiddle East & North Africa (excluding high income)Middle East & North Africa (IDA & IBRD countries)Middle incomeMoldovaMonacoMongoliaMontenegroMoroccoMozambiqueMyanmarNamibiaNauruNepalNetherlandsNew CaledoniaNew ZealandNicaraguaNigerNigeriaNorth AmericaNorwayOECD membersOmanOther small statesPacific island small statesPakistanPalauPanamaPapua New GuineaParaguayPeruPhilippinesPolandPortugalPost-demographic dividendPre-demographic dividendPuerto RicoQatarRomaniaRussian FederationRwandaSamoaSan MarinoSao Tome and PrincipeSaudi ArabiaSenegalSerbiaSeychellesSierra LeoneSingaporeSlovak RepublicSloveniaSmall statesSolomon IslandsSomaliaSouth AfricaSouth AsiaSouth Asia (IDA & IBRD)South SudanSpainSri LankaSt. Kitts and NevisSt. LuciaSt. Vincent and the GrenadinesSub-Saharan Africa Sub-Saharan Africa (excluding high income)Sub-Saharan Africa (IDA & IBRD countries)SudanSurinameSwazilandSwedenSwitzerlandSyrian Arab RepublicTajikistanTanzaniaThailandTimor-LesteTogoTongaTrinidad and TobagoTunisiaTurkeyTurkmenistanTuvaluUgandaUkraineUnited Arab EmiratesUnited KingdomUnited StatesUpper middle incomeUruguayUzbekistanVanuatuVenezuela, RBVietnamVirgin Islands (U.S.)West Bank and GazaWorldYemen, Rep.ZambiaZimbabwe línea de tiempo (timeline):
En esta escala de tiempo se presenta un gráfico de 1972 y 2016 de Guinea-Bissau. Los datos de 1971 están ausentes. El número de observaciones reales por fecha: 45.
Fuente (nombre):
Indicadores del desarrollo mundial
Fuente (organización):
World Bank national accounts data, and OECD National Accounts data files.
Categorías:
Economy & Growth
Se ha actualizado:
23 abr 2017 año
Los indicadores de los cambios de valor en los últimos años
Mínimo:
-5.012
1 ene 2004 año
Máximo:
112.895
1 ene 1987 año
A la fecha de observación
Valor
Cambio absoluto
El cambio con respecto al valor anterior
1 ene 1972 año
1.807
+1.807
0.0%
1 ene 1973 año
4.974
+3.167
175.24%
1 ene 1974 año
10.434
+5.46
109.75%
1 ene 1975 año
8.924
-1.509
-14.47%
1 ene 1976 año
7.203
-1.721
-19.29%
1 ene 1977 año
1.514
-5.689
-78.99%
1 ene 1978 año
3.066
+1.552
102.54%
1 ene 1979 año
6.336
+3.27
106.66%
1 ene 1980 año
4.28
-2.056
-32.45%
1 ene 1981 año
11.537
+7.257
169.55%
1 ene 1982 año
1.817
-9.72
-84.25%
1 ene 1983 año
16.542
+14.725
810.4%
1 ene 1984 año
23.307
+6.765
40.89%
1 ene 1985 año
59.402
+36.095
154.87%
1 ene 1986 año
32.314
-27.088
-45.6%
1 ene 1987 año
112.895
+80.581
249.37%
1 ene 1988 año
94.263
-18.631
-16.5%
1 ene 1989 año
79.545
-14.719
-15.61%
1 ene 1990 año
99.253
+19.708
24.78%
1 ene 1991 año
30.246
-69.007
-69.53%
1 ene 1992 año
67.894
+37.648
124.47%
1 ene 1993 año
64.981
-2.913
-4.29%
1 ene 1994 año
49.059
-15.922
-24.5%
1 ene 1995 año
23.249
-25.809
-52.61%
1 ene 1996 año
44.73
+21.481
92.39%
1 ene 1997 año
39.234
-5.496
-12.29%
1 ene 1998 año
34.138
-5.096
-12.99%
1 ene 1999 año
8.075
-26.063
-76.35%
1 ene 2000 año
12.306
+4.231
52.4%
1 ene 2001 año
80.9
+68.594
557.4%
1 ene 2002 año
6.769
-74.13
-91.63%
1 ene 2003 año
1.797
-4.972
-73.46%
1 ene 2004 año
-5.012
-6.809
-378.93%
1 ene 2005 año
-1.387
+3.625
-72.33%
1 ene 2006 año
5.801
+7.187
-518.28%
1 ene 2007 año
-2.274
-8.075
-139.2%
1 ene 2008 año
4.384
+6.658
-292.77%
1 ene 2009 año
12.466
+8.082
184.37%
1 ene 2010 año
-2.46
-14.926
-119.74%
1 ene 2011 año
2.933
+5.393
-219.21%
1 ene 2012 año
13.823
+10.891
371.37%
1 ene 2013 año
-0.78
-14.604
-105.64%
1 ene 2014 año
-1.02
-0.24
30.77%
1 ene 2015 año
5.424
+6.444
-631.64%
1 ene 2016 año
8.774
+3.351
61.78%
Ranking de los países por los datos estadísticos actuales


Comentarios: