29
/es/
es
AIzaSyAYiBZKx7MnpbEhh9jyipgxe19OcubqV5w
April 1, 2024
108662
Comoros
COM
true
2
1
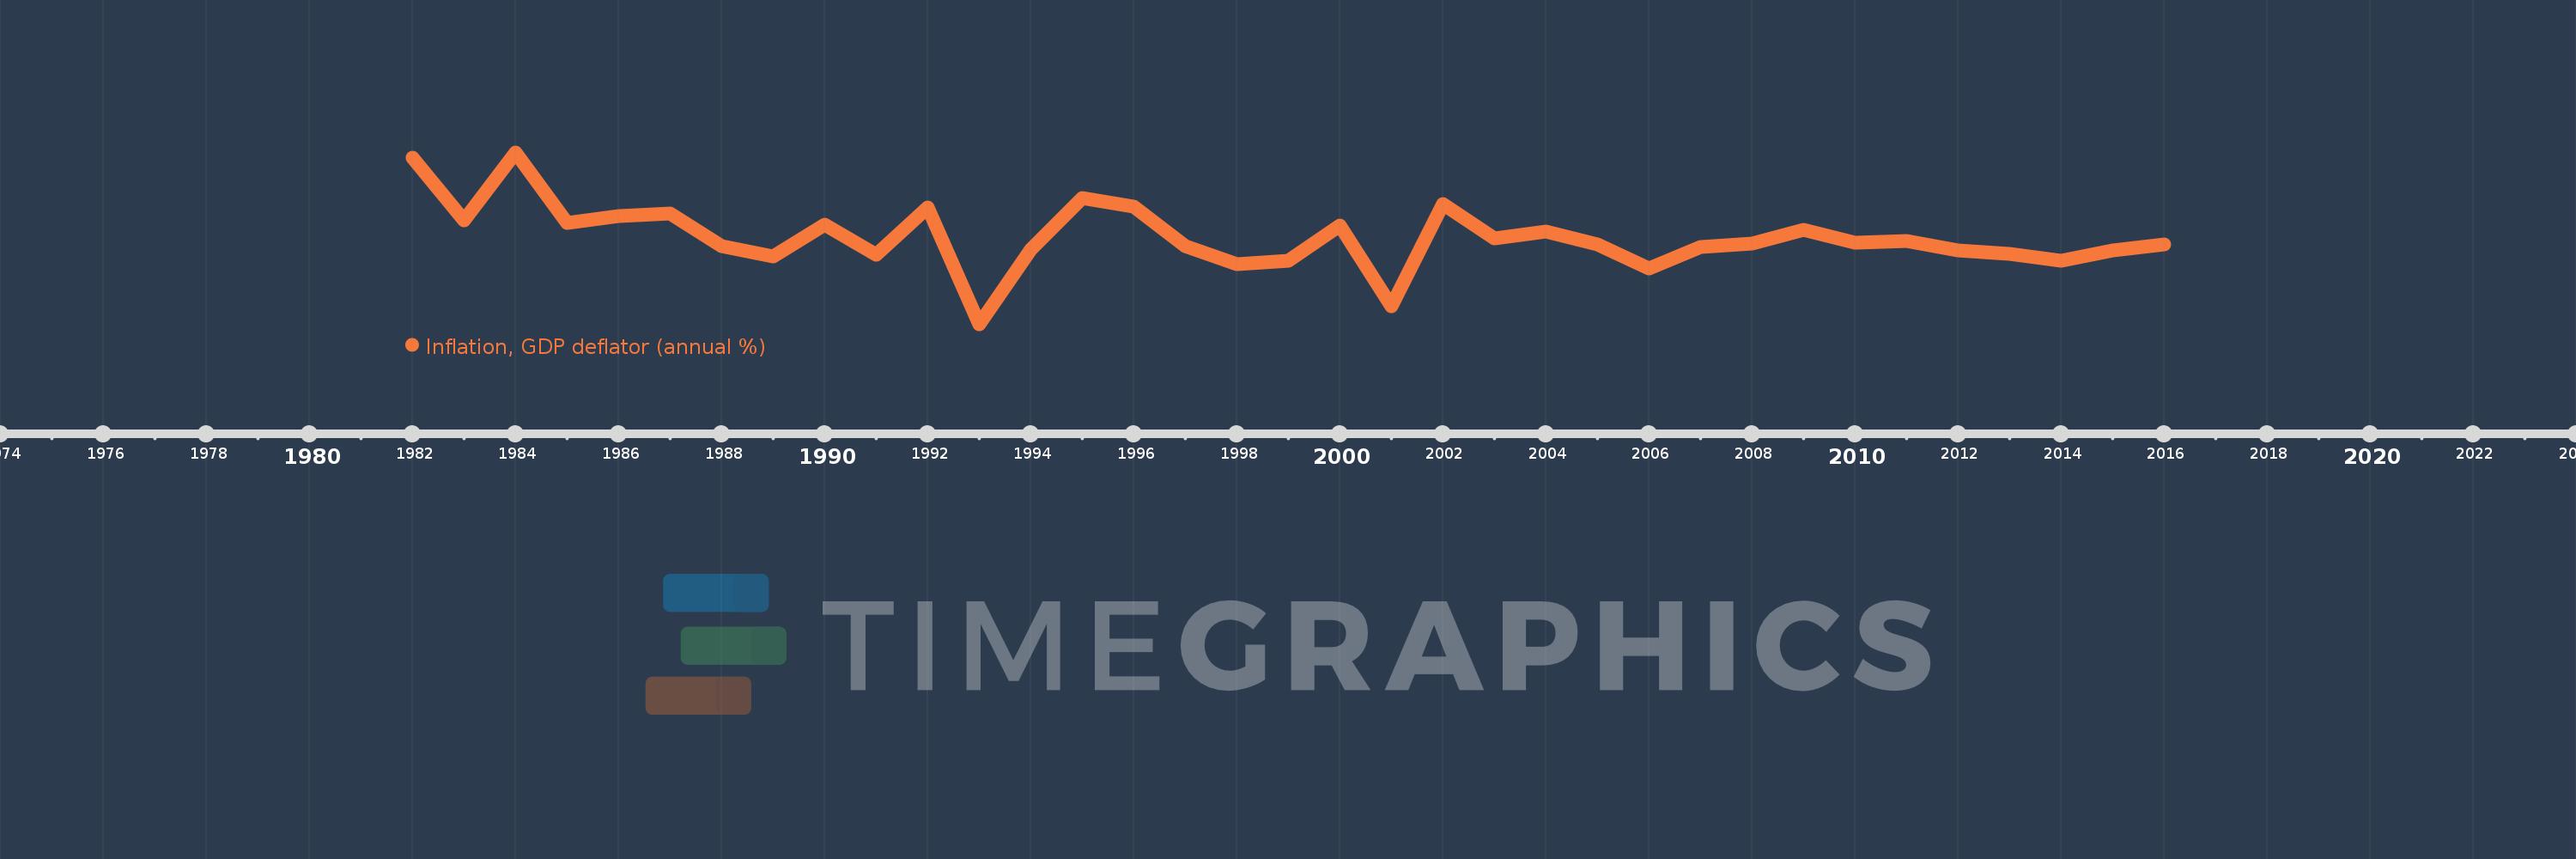
Inflation, GDP deflator (annual %)
2016,2015,2014,2013,2012,2011,2010,2009,2008,2007,2006,2005,2004,2003,2002,2001,2000,1999,1998,1997,1996,1995,1994,1993,1992,1991,1990,1989,1988,1987,1986,1985,1984,1983,1982
Estas estadísticas en otros países:
AfghanistanAlbaniaAlgeriaAndorraAngolaAntigua and BarbudaArab WorldArgentinaArmeniaArubaAustraliaAustriaAzerbaijanBahamas, TheBahrainBangladeshBarbadosBelarusBelgiumBelizeBeninBermudaBhutanBoliviaBosnia and HerzegovinaBotswanaBrazilBrunei DarussalamBulgariaBurkina FasoBurundiCabo VerdeCambodiaCameroonCanadaCaribbean small statesCayman IslandsCentral African RepublicCentral Europe and the BalticsChadChannel IslandsChileChinaColombiaComorosCongo, Dem. Rep.Congo, Rep.Costa RicaCote d'IvoireCroatiaCubaCyprusCzech RepublicDenmarkDjiboutiDominicaDominican RepublicEarly-demographic dividendEast Asia & PacificEast Asia & Pacific (excluding high income)East Asia & Pacific (IDA & IBRD countries)EcuadorEgypt, Arab Rep.El SalvadorEquatorial GuineaEritreaEstoniaEthiopiaEuro areaEurope & Central AsiaEurope & Central Asia (excluding high income)Europe & Central Asia (IDA & IBRD countries)European UnionFijiFinlandFragile and conflict affected situationsFranceFrench PolynesiaGabonGambia, TheGeorgiaGermanyGhanaGreeceGreenlandGrenadaGuatemalaGuineaGuinea-BissauGuyanaHaitiHeavily indebted poor countries (HIPC)High incomeHondurasHong Kong SAR, ChinaHungaryIBRD onlyIcelandIDA & IBRD totalIDA blendIDA onlyIDA totalIndiaIndonesiaIran, Islamic Rep.IraqIrelandIsle of ManIsraelItalyJamaicaJapanJordanKazakhstanKenyaKiribatiKorea, Rep.KosovoKuwaitKyrgyz RepublicLao PDRLate-demographic dividendLatin America & Caribbean Latin America & Caribbean (excluding high income)Latin America & the Caribbean (IDA & IBRD countries)LatviaLeast developed countries: UN classificationLebanonLesothoLiberiaLibyaLiechtensteinLithuaniaLow & middle incomeLow incomeLower middle incomeLuxembourgMacao SAR, ChinaMacedonia, FYRMadagascarMalawiMalaysiaMaldivesMaliMaltaMarshall IslandsMauritaniaMauritiusMexicoMicronesia, Fed. Sts.Middle East & North AfricaMiddle East & North Africa (excluding high income)Middle East & North Africa (IDA & IBRD countries)Middle incomeMoldovaMonacoMongoliaMontenegroMoroccoMozambiqueMyanmarNamibiaNauruNepalNetherlandsNew CaledoniaNew ZealandNicaraguaNigerNigeriaNorth AmericaNorwayOECD membersOmanOther small statesPacific island small statesPakistanPalauPanamaPapua New GuineaParaguayPeruPhilippinesPolandPortugalPost-demographic dividendPre-demographic dividendPuerto RicoQatarRomaniaRussian FederationRwandaSamoaSan MarinoSao Tome and PrincipeSaudi ArabiaSenegalSerbiaSeychellesSierra LeoneSingaporeSlovak RepublicSloveniaSmall statesSolomon IslandsSomaliaSouth AfricaSouth AsiaSouth Asia (IDA & IBRD)South SudanSpainSri LankaSt. Kitts and NevisSt. LuciaSt. Vincent and the GrenadinesSub-Saharan Africa Sub-Saharan Africa (excluding high income)Sub-Saharan Africa (IDA & IBRD countries)SudanSurinameSwazilandSwedenSwitzerlandSyrian Arab RepublicTajikistanTanzaniaThailandTimor-LesteTogoTongaTrinidad and TobagoTunisiaTurkeyTurkmenistanTuvaluUgandaUkraineUnited Arab EmiratesUnited KingdomUnited StatesUpper middle incomeUruguayUzbekistanVanuatuVenezuela, RBVietnamVirgin Islands (U.S.)West Bank and GazaWorldYemen, Rep.ZambiaZimbabwe línea de tiempo (timeline):
En esta escala de tiempo se presenta un gráfico de 1982 y 2016 de Comoros. Los datos de 1981 están ausentes. El número de observaciones reales por fecha: 35.
Fuente (nombre):
Indicadores del desarrollo mundial
Fuente (organización):
World Bank national accounts data, and OECD National Accounts data files.
Categorías:
Economy & Growth
Se ha actualizado:
23 abr 2017 año
Los indicadores de los cambios de valor en los últimos años
Mínimo:
-6.765
1 ene 1993 año
Máximo:
15.207
1 ene 1984 año
A la fecha de observación
Valor
Cambio absoluto
El cambio con respecto al valor anterior
1 ene 1982 año
14.569
+14.569
0.0%
1 ene 1983 año
6.529
-8.039
-55.18%
1 ene 1984 año
15.207
+8.678
132.91%
1 ene 1985 año
6.16
-9.048
-59.49%
1 ene 1986 año
7.071
+0.911
14.79%
1 ene 1987 año
7.393
+0.322
4.55%
1 ene 1988 año
3.223
-4.17
-56.4%
1 ene 1989 año
1.937
-1.286
-39.89%
1 ene 1990 año
5.961
+4.024
207.7%
1 ene 1991 año
2.175
-3.786
-63.51%
1 ene 1992 año
8.119
+5.944
273.28%
1 ene 1993 año
-6.765
-14.884
-183.31%
1 ene 1994 año
2.833
+9.598
-141.88%
1 ene 1995 año
9.417
+6.584
232.4%
1 ene 1996 año
8.321
-1.096
-11.64%
1 ene 1997 año
3.199
-5.122
-61.55%
1 ene 1998 año
0.924
-2.275
-71.12%
1 ene 1999 año
1.346
+0.423
45.74%
1 ene 2000 año
5.812
+4.465
331.65%
1 ene 2001 año
-4.46
-10.272
-176.74%
1 ene 2002 año
8.63
+13.09
-293.5%
1 ene 2003 año
4.171
-4.46
-51.67%
1 ene 2004 año
5.112
+0.941
22.56%
1 ene 2005 año
3.389
-1.723
-33.71%
1 ene 2006 año
0.316
-3.073
-90.68%
1 ene 2007 año
3.111
+2.795
884.7%
1 ene 2008 año
3.545
+0.434
13.95%
1 ene 2009 año
5.274
+1.73
48.79%
1 ene 2010 año
3.63
-1.644
-31.18%
1 ene 2011 año
3.873
+0.243
6.7%
1 ene 2012 año
2.624
-1.249
-32.24%
1 ene 2013 año
2.28
-0.344
-13.12%
1 ene 2014 año
1.327
-0.953
-41.81%
1 ene 2015 año
2.66
+1.333
100.48%
1 ene 2016 año
3.426
+0.766
28.82%
Ranking de los países por los datos estadísticos actuales


Comentarios: