29
/es/
es
AIzaSyAYiBZKx7MnpbEhh9jyipgxe19OcubqV5w
April 1, 2024
274893
United Arab Emirates
ARE
true
2
1
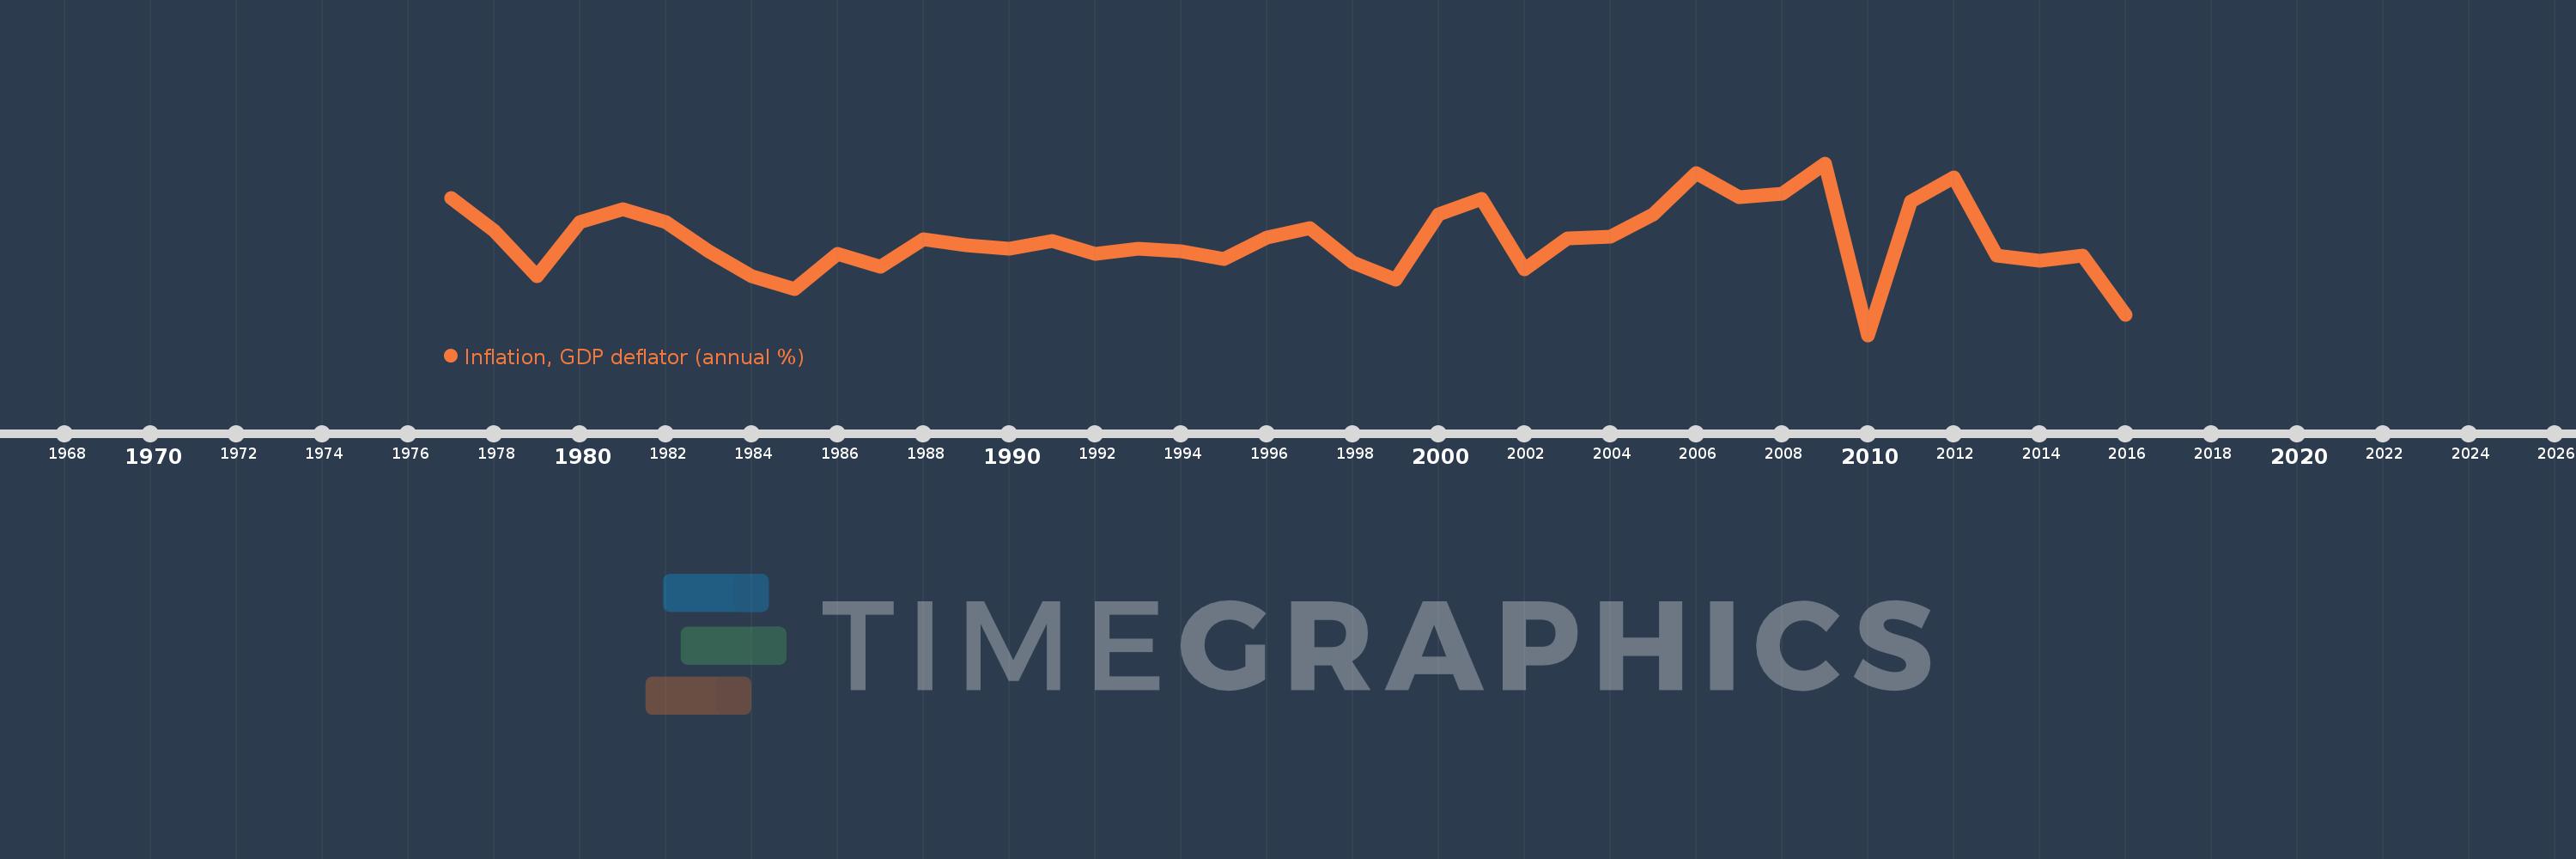
Inflation, GDP deflator (annual %)
2016,2015,2014,2013,2012,2011,2010,2009,2008,2007,2006,2005,2004,2003,2002,2001,2000,1999,1998,1997,1996,1995,1994,1993,1992,1991,1990,1989,1988,1987,1986,1985,1984,1983,1982,1981,1980,1979,1978,1977
Estas estadísticas en otros países:
AfghanistanAlbaniaAlgeriaAndorraAngolaAntigua and BarbudaArab WorldArgentinaArmeniaArubaAustraliaAustriaAzerbaijanBahamas, TheBahrainBangladeshBarbadosBelarusBelgiumBelizeBeninBermudaBhutanBoliviaBosnia and HerzegovinaBotswanaBrazilBrunei DarussalamBulgariaBurkina FasoBurundiCabo VerdeCambodiaCameroonCanadaCaribbean small statesCayman IslandsCentral African RepublicCentral Europe and the BalticsChadChannel IslandsChileChinaColombiaComorosCongo, Dem. Rep.Congo, Rep.Costa RicaCote d'IvoireCroatiaCubaCyprusCzech RepublicDenmarkDjiboutiDominicaDominican RepublicEarly-demographic dividendEast Asia & PacificEast Asia & Pacific (excluding high income)East Asia & Pacific (IDA & IBRD countries)EcuadorEgypt, Arab Rep.El SalvadorEquatorial GuineaEritreaEstoniaEthiopiaEuro areaEurope & Central AsiaEurope & Central Asia (excluding high income)Europe & Central Asia (IDA & IBRD countries)European UnionFijiFinlandFragile and conflict affected situationsFranceFrench PolynesiaGabonGambia, TheGeorgiaGermanyGhanaGreeceGreenlandGrenadaGuatemalaGuineaGuinea-BissauGuyanaHaitiHeavily indebted poor countries (HIPC)High incomeHondurasHong Kong SAR, ChinaHungaryIBRD onlyIcelandIDA & IBRD totalIDA blendIDA onlyIDA totalIndiaIndonesiaIran, Islamic Rep.IraqIrelandIsle of ManIsraelItalyJamaicaJapanJordanKazakhstanKenyaKiribatiKorea, Rep.KosovoKuwaitKyrgyz RepublicLao PDRLate-demographic dividendLatin America & Caribbean Latin America & Caribbean (excluding high income)Latin America & the Caribbean (IDA & IBRD countries)LatviaLeast developed countries: UN classificationLebanonLesothoLiberiaLibyaLiechtensteinLithuaniaLow & middle incomeLow incomeLower middle incomeLuxembourgMacao SAR, ChinaMacedonia, FYRMadagascarMalawiMalaysiaMaldivesMaliMaltaMarshall IslandsMauritaniaMauritiusMexicoMicronesia, Fed. Sts.Middle East & North AfricaMiddle East & North Africa (excluding high income)Middle East & North Africa (IDA & IBRD countries)Middle incomeMoldovaMonacoMongoliaMontenegroMoroccoMozambiqueMyanmarNamibiaNauruNepalNetherlandsNew CaledoniaNew ZealandNicaraguaNigerNigeriaNorth AmericaNorwayOECD membersOmanOther small statesPacific island small statesPakistanPalauPanamaPapua New GuineaParaguayPeruPhilippinesPolandPortugalPost-demographic dividendPre-demographic dividendPuerto RicoQatarRomaniaRussian FederationRwandaSamoaSan MarinoSao Tome and PrincipeSaudi ArabiaSenegalSerbiaSeychellesSierra LeoneSingaporeSlovak RepublicSloveniaSmall statesSolomon IslandsSomaliaSouth AfricaSouth AsiaSouth Asia (IDA & IBRD)South SudanSpainSri LankaSt. Kitts and NevisSt. LuciaSt. Vincent and the GrenadinesSub-Saharan Africa Sub-Saharan Africa (excluding high income)Sub-Saharan Africa (IDA & IBRD countries)SudanSurinameSwazilandSwedenSwitzerlandSyrian Arab RepublicTajikistanTanzaniaThailandTimor-LesteTogoTongaTrinidad and TobagoTunisiaTurkeyTurkmenistanTuvaluUgandaUkraineUnited Arab EmiratesUnited KingdomUnited StatesUpper middle incomeUruguayUzbekistanVanuatuVenezuela, RBVietnamVirgin Islands (U.S.)West Bank and GazaWorldYemen, Rep.ZambiaZimbabwe línea de tiempo (timeline):
En esta escala de tiempo se presenta un gráfico de 1977 y 2016 de United Arab Emirates. Los datos de 1976 están ausentes. El número de observaciones reales por fecha: 40.
Fuente (nombre):
Indicadores del desarrollo mundial
Fuente (organización):
World Bank national accounts data, and OECD National Accounts data files.
Categorías:
Economy & Growth
Se ha actualizado:
23 abr 2017 año
Los indicadores de los cambios de valor en los últimos años
Mínimo:
-15.183
1 ene 2010 año
Máximo:
18.533
1 ene 2009 año
A la fecha de observación
Valor
Cambio absoluto
El cambio con respecto al valor anterior
1 ene 1977 año
11.774
+11.774
0.0%
1 ene 1978 año
5.256
-6.519
-55.36%
1 ene 1979 año
-3.661
-8.917
-169.66%
1 ene 1980 año
7.051
+10.712
-292.59%
1 ene 1981 año
9.516
+2.465
34.96%
1 ene 1982 año
7.054
-2.461
-25.87%
1 ene 1983 año
1.313
-5.742
-81.39%
1 ene 1984 año
-3.618
-4.931
-375.58%
1 ene 1985 año
-6.097
-2.479
68.53%
1 ene 1986 año
0.741
+6.838
-112.14%
1 ene 1987 año
-1.698
-2.439
-329.36%
1 ene 1988 año
3.686
+5.384
-316.99%
1 ene 1989 año
2.381
-1.305
-35.4%
1 ene 1990 año
1.751
-0.63
-26.45%
1 ene 1991 año
3.336
+1.585
90.48%
1 ene 1992 año
0.811
-2.525
-75.69%
1 ene 1993 año
1.807
+0.996
122.83%
1 ene 1994 año
1.278
-0.529
-29.27%
1 ene 1995 año
-0.262
-1.541
-120.54%
1 ene 1996 año
3.907
+4.17
-1.59 mil%
1 ene 1997 año
5.773
+1.866
47.74%
1 ene 1998 año
-0.952
-6.725
-116.5%
1 ene 1999 año
-4.254
-3.302
346.75%
1 ene 2000 año
8.443
+12.698
-298.46%
1 ene 2001 año
11.46
+3.016
35.72%
1 ene 2002 año
-2.349
-13.809
-120.5%
1 ene 2003 año
3.771
+6.12
-260.51%
1 ene 2004 año
4.072
+0.302
8.0%
1 ene 2005 año
8.501
+4.429
108.76%
1 ene 2006 año
16.526
+8.025
94.39%
1 ene 2007 año
11.957
-4.569
-27.65%
1 ene 2008 año
12.539
+0.582
4.87%
1 ene 2009 año
18.533
+5.994
47.8%
1 ene 2010 año
-15.183
-33.716
-181.92%
1 ene 2011 año
11.003
+26.186
-172.47%
1 ene 2012 año
15.81
+4.807
43.68%
1 ene 2013 año
0.331
-15.479
-97.91%
1 ene 2014 año
-0.637
-0.968
-292.58%
1 ene 2015 año
0.347
+0.985
-154.49%
1 ene 2016 año
-11.213
-11.56
-3.33 mil%
Ranking de los países por los datos estadísticos actuales


Comentarios: