29
/es/
es
AIzaSyAYiBZKx7MnpbEhh9jyipgxe19OcubqV5w
April 1, 2024
269732
Turkey
TUR
true
2
1
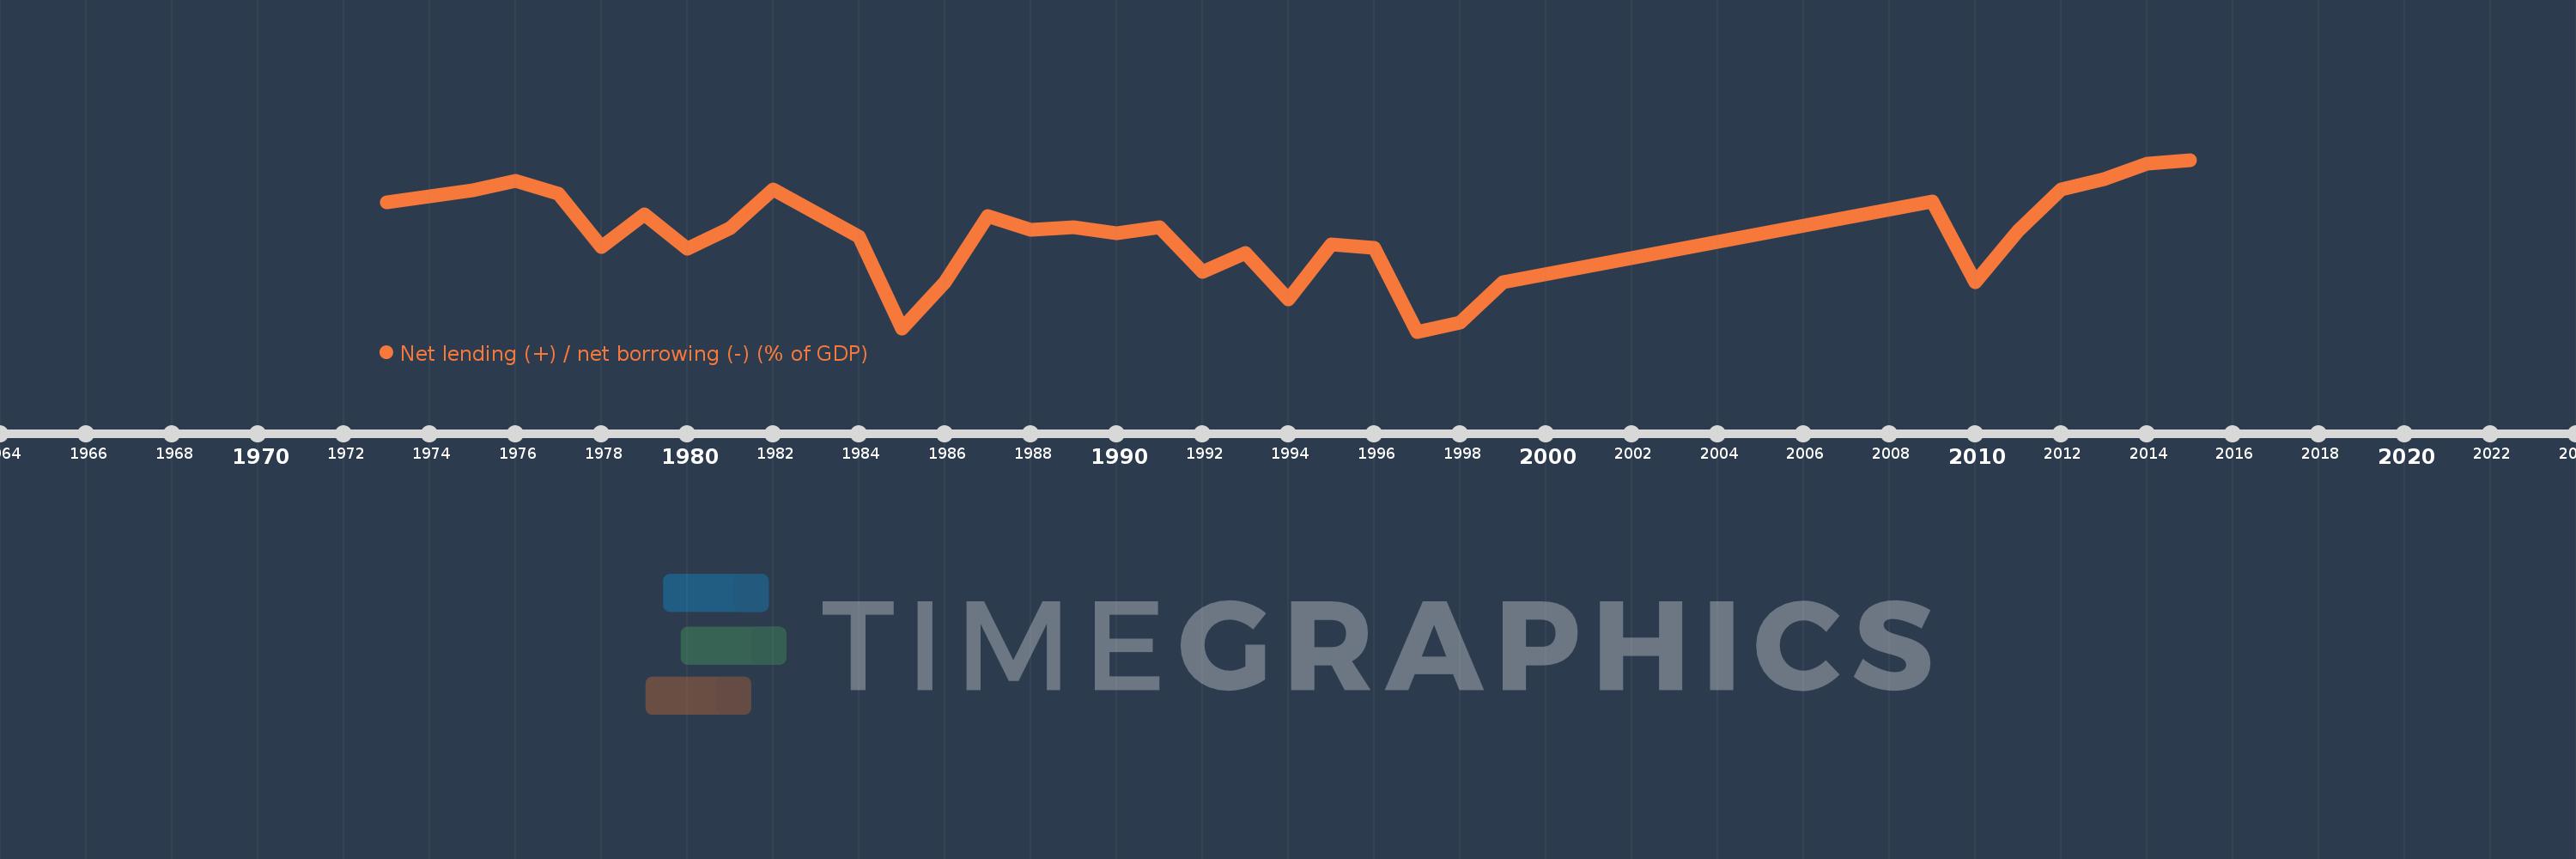
Net lending (+) / net borrowing (-) (% of GDP)
2015,2014,2013,2012,2011,2010,2009,1999,1998,1997,1996,1995,1994,1993,1992,1991,1990,1989,1988,1987,1986,1985,1984,1982,1981,1980,1979,1978,1977,1976,1975,1974,1973
Estas estadísticas en otros países:
AfghanistanAlbaniaAlgeriaAngolaAntigua and BarbudaArmeniaAustraliaAustriaAzerbaijanBahamas, TheBahrainBangladeshBarbadosBelarusBelgiumBelizeBhutanBoliviaBosnia and HerzegovinaBrazilBurundiCabo VerdeCambodiaCanadaCaribbean small statesCentral African RepublicCentral Europe and the BalticsChileCongo, Dem. Rep.Congo, Rep.Costa RicaCote d'IvoireCroatiaCyprusCzech RepublicDenmarkDominicaDominican RepublicEarly-demographic dividendEgypt, Arab Rep.El SalvadorEquatorial GuineaEstoniaEthiopiaEuro areaEurope & Central AsiaEurope & Central Asia (excluding high income)Europe & Central Asia (IDA & IBRD countries)European UnionFijiFinlandFranceGambia, TheGeorgiaGermanyGreeceGuatemalaHigh incomeHondurasHungaryIcelandIDA blendIndiaIndonesiaIran, Islamic Rep.IraqIrelandIsraelItalyJamaicaKazakhstanKiribatiKorea, Rep.Kyrgyz RepublicLao PDRLatin America & Caribbean Latin America & Caribbean (excluding high income)Latin America & the Caribbean (IDA & IBRD countries)LatviaLebanonLithuaniaLower middle incomeLuxembourgMacao SAR, ChinaMacedonia, FYRMadagascarMalawiMaldivesMaliMaltaMauritiusMexicoMicronesia, Fed. Sts.Middle East & North Africa (excluding high income)Middle East & North Africa (IDA & IBRD countries)MoldovaMongoliaMoroccoMozambiqueNamibiaNepalNetherlandsNew ZealandNicaraguaNigeriaNorth AmericaNorwayOECD membersOmanOther small statesPacific island small statesPakistanParaguayPeruPhilippinesPolandPortugalPost-demographic dividendQatarRomaniaRussian FederationRwandaSamoaSan MarinoSao Tome and PrincipeSenegalSerbiaSierra LeoneSingaporeSlovak RepublicSmall statesSolomon IslandsSouth AfricaSouth AsiaSouth Asia (IDA & IBRD)SpainSri LankaSub-Saharan Africa Sub-Saharan Africa (excluding high income)Sub-Saharan Africa (IDA & IBRD countries)SurinameSwazilandSwedenSwitzerlandSyrian Arab RepublicThailandTimor-LesteTrinidad and TobagoTurkeyUgandaUkraineUnited Arab EmiratesUnited KingdomUnited StatesUruguayVanuatuVietnamWest Bank and GazaWorldYemen, Rep.Zimbabwe línea de tiempo (timeline):
En esta escala de tiempo se presenta un gráfico de 1973 y 2015 de Turkey. Los datos de 1972 están ausentes. El número de observaciones reales por fecha: 33.
Fuente (nombre):
Indicadores del desarrollo mundial
Fuente (organización):
International Monetary Fund, Government Finance Statistics Yearbook and data files.
Categorías:
Public Sector
Se ha actualizado:
23 abr 2017 año
Los indicadores de los cambios de valor en los últimos años
Mínimo:
-8.381
1 ene 1997 año
Máximo:
0.495
1 ene 2015 año
A la fecha de observación
Valor
Cambio absoluto
El cambio con respecto al valor anterior
1 ene 1973 año
-1.695
-1.695
0.0%
1 ene 1974 año
-1.374
+0.321
-18.96%
1 ene 1975 año
-1.069
+0.305
-22.18%
1 ene 1976 año
-0.605
+0.464
-43.4%
1 ene 1977 año
-1.276
-0.67
110.82%
1 ene 1978 año
-4.023
-2.748
215.44%
1 ene 1979 año
-2.301
+1.722
-42.81%
1 ene 1980 año
-4.078
-1.777
77.24%
1 ene 1981 año
-3.055
+1.023
-25.09%
1 ene 1982 año
-1.018
+2.038
-66.69%
1 ene 1984 año
-3.464
-2.446
240.41%
1 ene 1985 año
-8.245
-4.781
138.02%
1 ene 1986 año
-5.836
+2.409
-29.21%
1 ene 1987 año
-2.431
+3.406
-58.35%
1 ene 1988 año
-3.116
-0.685
28.18%
1 ene 1989 año
-2.969
+0.147
-4.72%
1 ene 1990 año
-3.286
-0.318
10.7%
1 ene 1991 año
-2.988
+0.299
-9.09%
1 ene 1992 año
-5.279
-2.291
76.69%
1 ene 1993 año
-4.316
+0.964
-18.25%
1 ene 1994 año
-6.701
-2.385
55.26%
1 ene 1995 año
-3.889
+2.811
-41.95%
1 ene 1996 año
-4.074
-0.185
4.75%
1 ene 1997 año
-8.381
-4.306
105.7%
1 ene 1998 año
-7.935
+0.445
-5.32%
1 ene 1999 año
-5.848
+2.087
-26.3%
1 ene 2009 año
-1.641
+4.207
-71.94%
1 ene 2010 año
-5.819
-4.179
254.67%
1 ene 2011 año
-3.152
+2.668
-45.84%
1 ene 2012 año
-1.052
+2.099
-66.61%
1 ene 2013 año
-0.49
+0.562
-53.39%
1 ene 2014 año
0.286
+0.777
-158.33%
1 ene 2015 año
0.495
+0.209
72.9%
Ranking de los países por los datos estadísticos actuales


Comentarios: