29
/es/
es
AIzaSyAYiBZKx7MnpbEhh9jyipgxe19OcubqV5w
April 1, 2024
209608
New Zealand
NZL
true
2
1
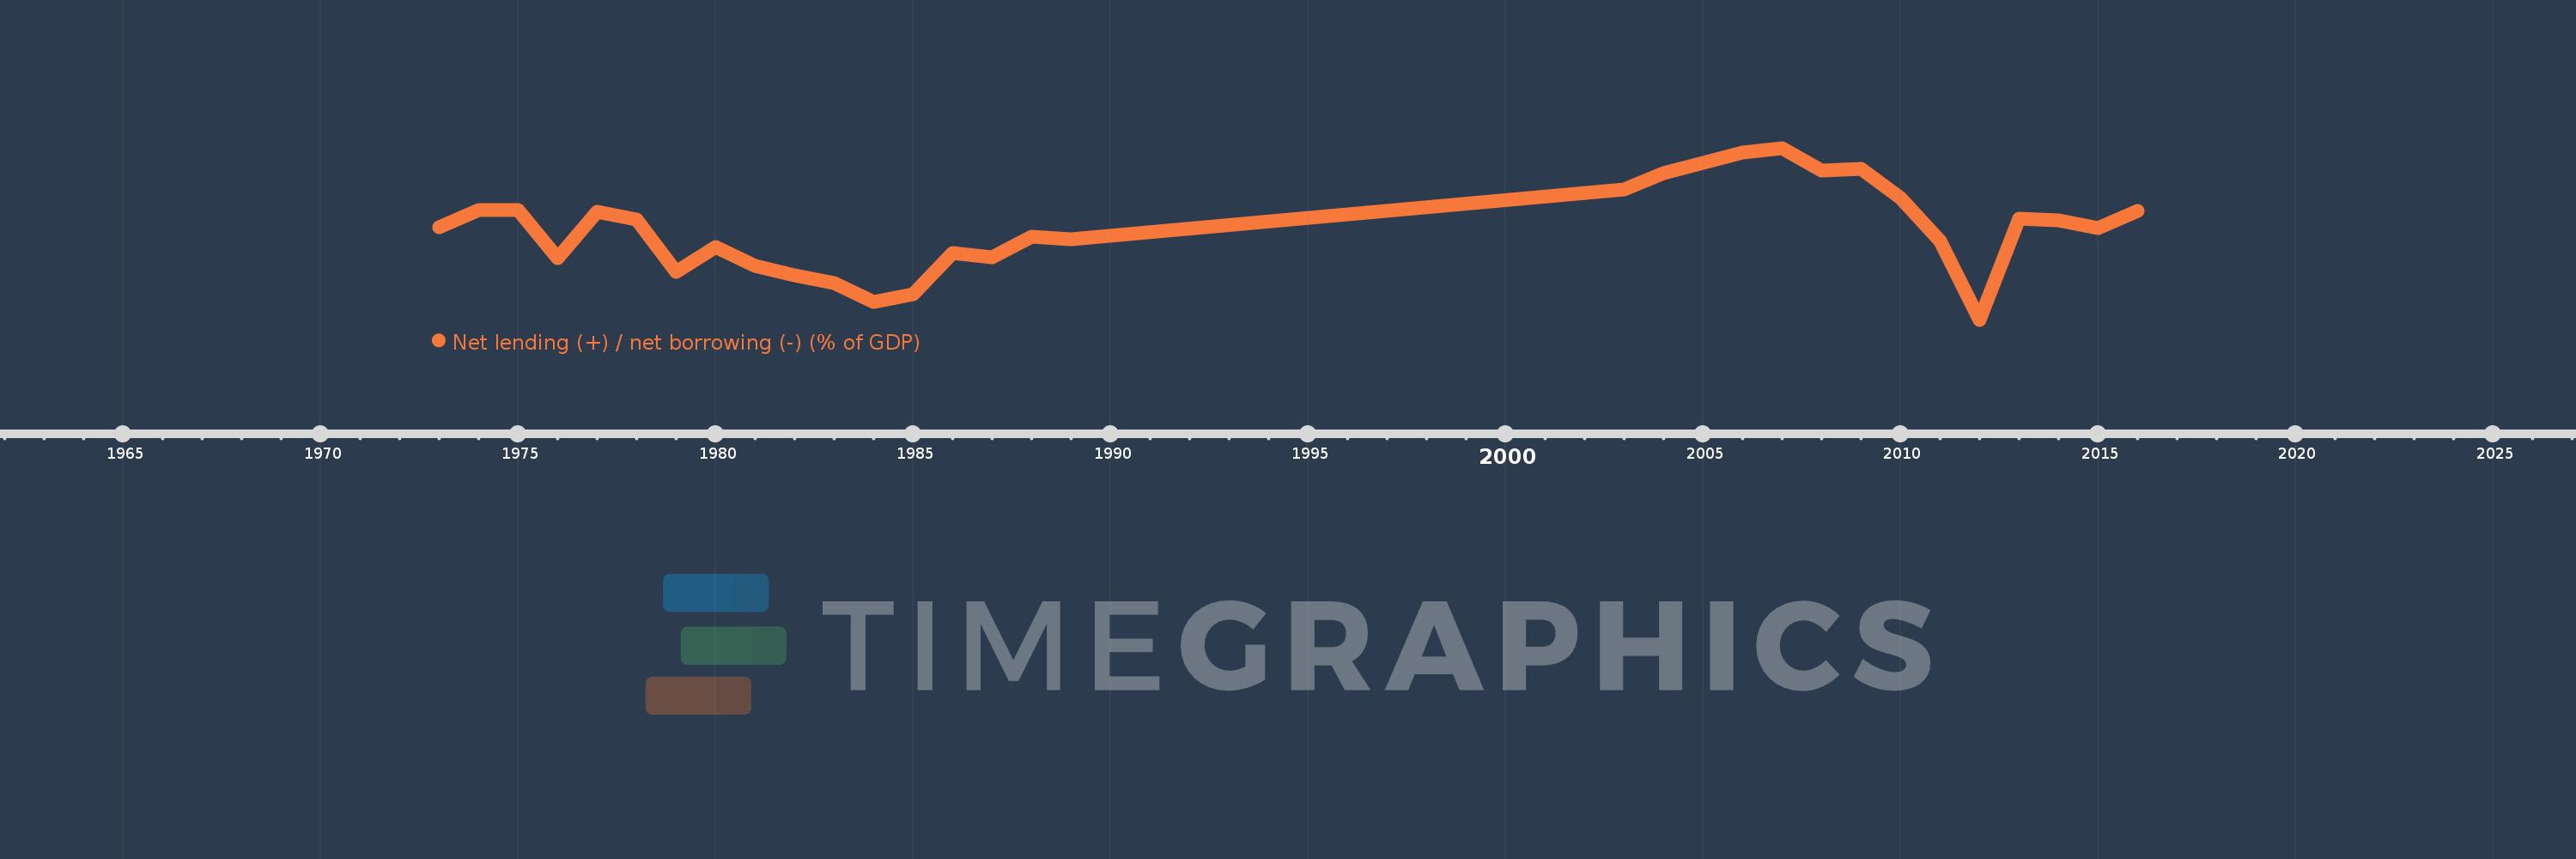
Net lending (+) / net borrowing (-) (% of GDP)
2016,2015,2014,2013,2012,2011,2010,2009,2008,2007,2006,2005,2004,2003,1989,1988,1987,1986,1985,1984,1983,1982,1981,1980,1979,1978,1977,1976,1975,1974,1973
Estas estadísticas en otros países:
AfghanistanAlbaniaAlgeriaAngolaAntigua and BarbudaArmeniaAustraliaAustriaAzerbaijanBahamas, TheBahrainBangladeshBarbadosBelarusBelgiumBelizeBhutanBoliviaBosnia and HerzegovinaBrazilBurundiCabo VerdeCambodiaCanadaCaribbean small statesCentral African RepublicCentral Europe and the BalticsChileCongo, Dem. Rep.Congo, Rep.Costa RicaCote d'IvoireCroatiaCyprusCzech RepublicDenmarkDominicaDominican RepublicEarly-demographic dividendEgypt, Arab Rep.El SalvadorEquatorial GuineaEstoniaEthiopiaEuro areaEurope & Central AsiaEurope & Central Asia (excluding high income)Europe & Central Asia (IDA & IBRD countries)European UnionFijiFinlandFranceGambia, TheGeorgiaGermanyGreeceGuatemalaHigh incomeHondurasHungaryIcelandIDA blendIndiaIndonesiaIran, Islamic Rep.IraqIrelandIsraelItalyJamaicaKazakhstanKiribatiKorea, Rep.Kyrgyz RepublicLao PDRLatin America & Caribbean Latin America & Caribbean (excluding high income)Latin America & the Caribbean (IDA & IBRD countries)LatviaLebanonLithuaniaLower middle incomeLuxembourgMacao SAR, ChinaMacedonia, FYRMadagascarMalawiMaldivesMaliMaltaMauritiusMexicoMicronesia, Fed. Sts.Middle East & North Africa (excluding high income)Middle East & North Africa (IDA & IBRD countries)MoldovaMongoliaMoroccoMozambiqueNamibiaNepalNetherlandsNew ZealandNicaraguaNigeriaNorth AmericaNorwayOECD membersOmanOther small statesPacific island small statesPakistanParaguayPeruPhilippinesPolandPortugalPost-demographic dividendQatarRomaniaRussian FederationRwandaSamoaSan MarinoSao Tome and PrincipeSenegalSerbiaSierra LeoneSingaporeSlovak RepublicSmall statesSolomon IslandsSouth AfricaSouth AsiaSouth Asia (IDA & IBRD)SpainSri LankaSub-Saharan Africa Sub-Saharan Africa (excluding high income)Sub-Saharan Africa (IDA & IBRD countries)SurinameSwazilandSwedenSwitzerlandSyrian Arab RepublicThailandTimor-LesteTrinidad and TobagoTurkeyUgandaUkraineUnited Arab EmiratesUnited KingdomUnited StatesUruguayVanuatuVietnamWest Bank and GazaWorldYemen, Rep.Zimbabwe línea de tiempo (timeline):
En esta escala de tiempo se presenta un gráfico de 1973 y 2016 de New Zealand. Los datos de 1972 están ausentes. El número de observaciones reales por fecha: 31.
Fuente (nombre):
Indicadores del desarrollo mundial
Fuente (organización):
International Monetary Fund, Government Finance Statistics Yearbook and data files.
Categorías:
Public Sector
Se ha actualizado:
23 abr 2017 año
Los indicadores de los cambios de valor en los últimos años
Mínimo:
-7.697
1 ene 2012 año
Máximo:
4.637
1 ene 2007 año
A la fecha de observación
Valor
Cambio absoluto
El cambio con respecto al valor anterior
1 ene 1973 año
-1.08
-1.08
0.0%
1 ene 1974 año
0.196
+1.275
-118.12%
1 ene 1975 año
0.168
-0.027
-14.04%
1 ene 1976 año
-3.249
-3.417
-2.03 mil%
1 ene 1977 año
0.05
+3.299
-101.54%
1 ene 1978 año
-0.505
-0.555
-1.11 mil%
1 ene 1979 año
-4.247
-3.742
740.96%
1 ene 1980 año
-2.469
+1.778
-41.86%
1 ene 1981 año
-3.84
-1.371
55.53%
1 ene 1982 año
-4.508
-0.667
17.38%
1 ene 1983 año
-5.042
-0.535
11.87%
1 ene 1984 año
-6.445
-1.403
27.82%
1 ene 1985 año
-5.863
+0.582
-9.03%
1 ene 1986 año
-2.895
+2.968
-50.62%
1 ene 1987 año
-3.223
-0.328
11.33%
1 ene 1988 año
-1.758
+1.465
-45.45%
1 ene 1989 año
-1.899
-0.141
8.0%
1 ene 2003 año
1.63
+3.529
-185.82%
1 ene 2004 año
2.805
+1.175
72.08%
1 ene 2005 año
3.548
+0.743
26.5%
1 ene 2006 año
4.339
+0.791
22.3%
1 ene 2007 año
4.637
+0.297
6.85%
1 ene 2008 año
3.004
-1.633
-35.22%
1 ene 2009 año
3.132
+0.128
4.26%
1 ene 2010 año
1.063
-2.069
-66.07%
1 ene 2011 año
-2.035
-3.097
-291.49%
1 ene 2012 año
-7.697
-5.662
278.26%
1 ene 2013 año
-0.438
+7.259
-94.3%
1 ene 2014 año
-0.547
-0.109
24.89%
1 ene 2015 año
-1.117
-0.569
103.98%
1 ene 2016 año
0.115
+1.232
-110.31%
Ranking de los países por los datos estadísticos actuales


Comentarios: