29
/es/
es
AIzaSyAYiBZKx7MnpbEhh9jyipgxe19OcubqV5w
April 1, 2024
134419
France
FRA
true
2
1
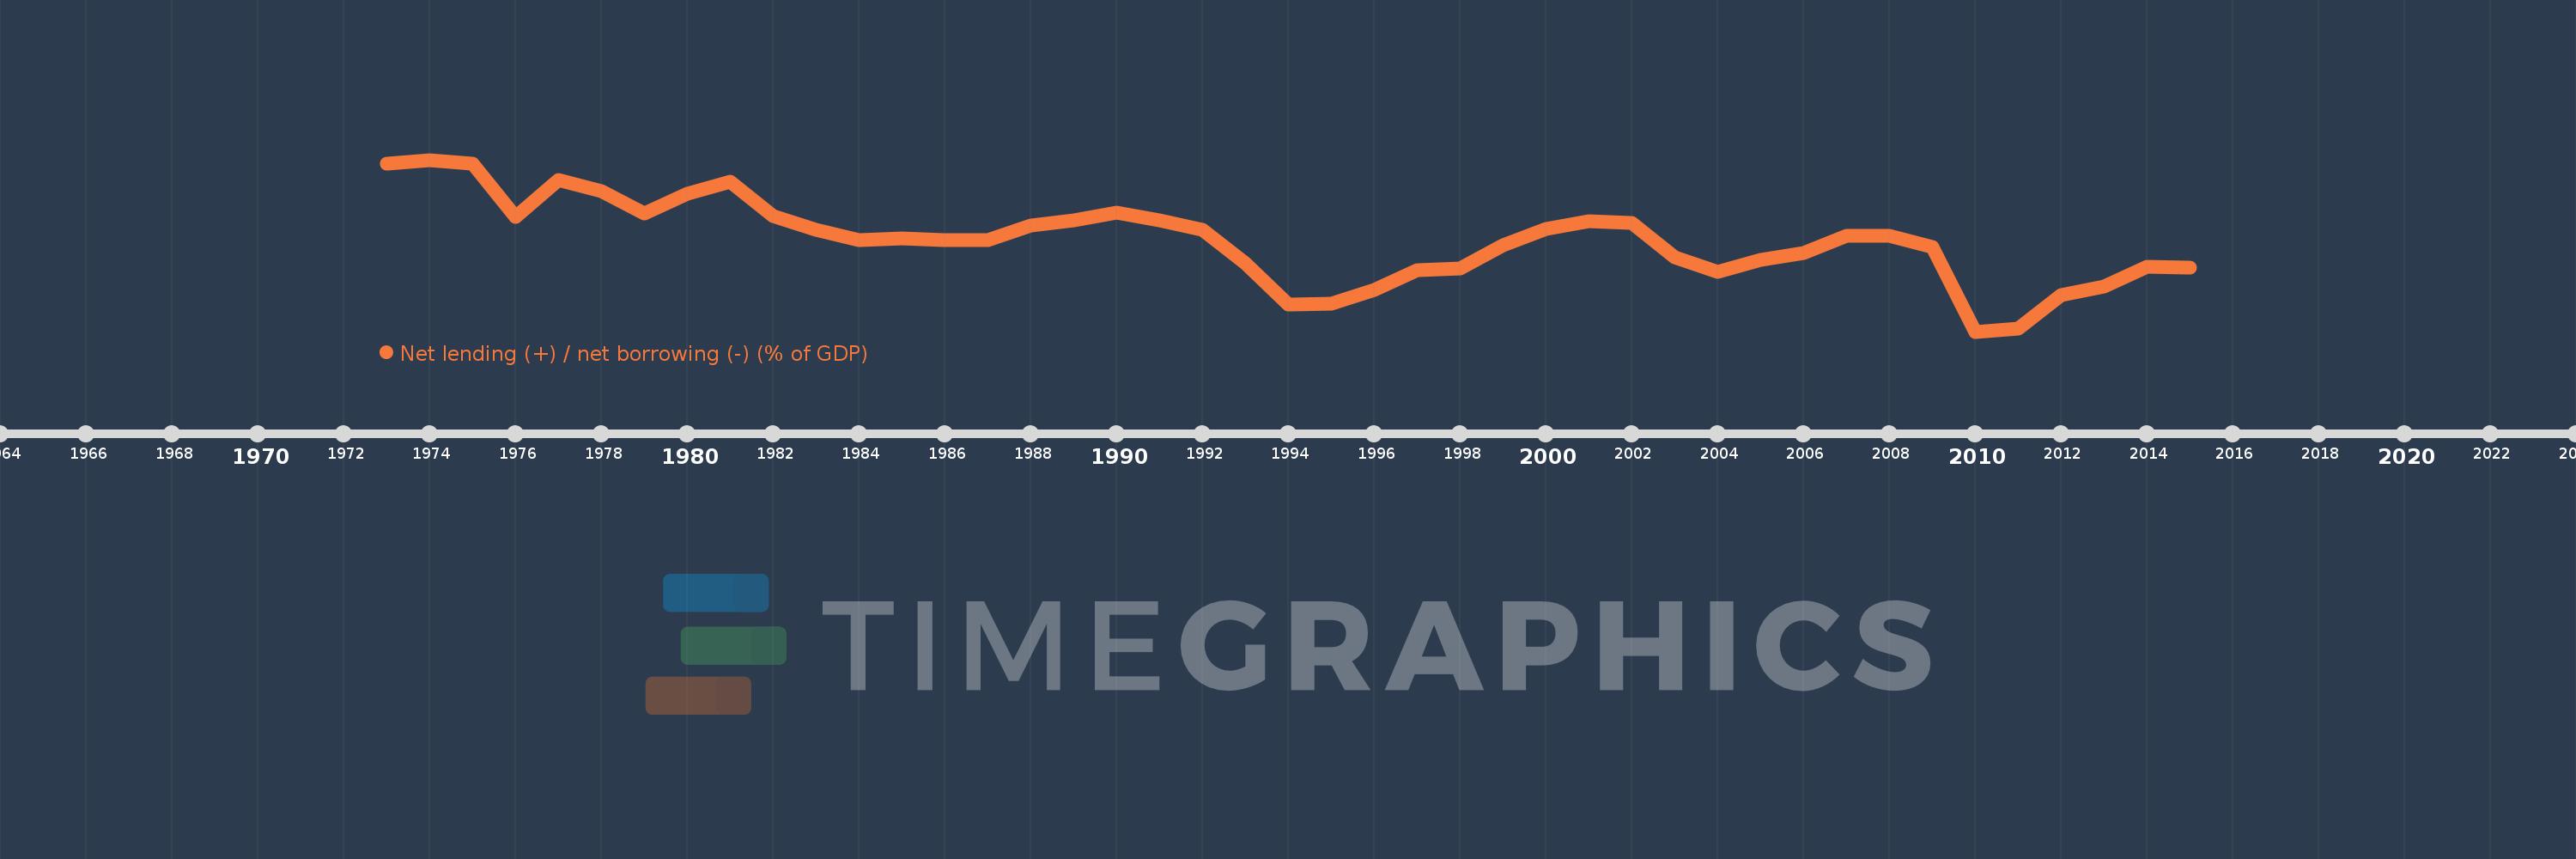
Net lending (+) / net borrowing (-) (% of GDP)
2015,2014,2013,2012,2011,2010,2009,2008,2007,2006,2005,2004,2003,2002,2001,2000,1999,1998,1997,1996,1995,1994,1993,1992,1991,1990,1989,1988,1987,1986,1985,1984,1983,1982,1981,1980,1979,1978,1977,1976,1975,1974,1973
Estas estadísticas en otros países:
AfghanistanAlbaniaAlgeriaAngolaAntigua and BarbudaArmeniaAustraliaAustriaAzerbaijanBahamas, TheBahrainBangladeshBarbadosBelarusBelgiumBelizeBhutanBoliviaBosnia and HerzegovinaBrazilBurundiCabo VerdeCambodiaCanadaCaribbean small statesCentral African RepublicCentral Europe and the BalticsChileCongo, Dem. Rep.Congo, Rep.Costa RicaCote d'IvoireCroatiaCyprusCzech RepublicDenmarkDominicaDominican RepublicEarly-demographic dividendEgypt, Arab Rep.El SalvadorEquatorial GuineaEstoniaEthiopiaEuro areaEurope & Central AsiaEurope & Central Asia (excluding high income)Europe & Central Asia (IDA & IBRD countries)European UnionFijiFinlandFranceGambia, TheGeorgiaGermanyGreeceGuatemalaHigh incomeHondurasHungaryIcelandIDA blendIndiaIndonesiaIran, Islamic Rep.IraqIrelandIsraelItalyJamaicaKazakhstanKiribatiKorea, Rep.Kyrgyz RepublicLao PDRLatin America & Caribbean Latin America & Caribbean (excluding high income)Latin America & the Caribbean (IDA & IBRD countries)LatviaLebanonLithuaniaLower middle incomeLuxembourgMacao SAR, ChinaMacedonia, FYRMadagascarMalawiMaldivesMaliMaltaMauritiusMexicoMicronesia, Fed. Sts.Middle East & North Africa (excluding high income)Middle East & North Africa (IDA & IBRD countries)MoldovaMongoliaMoroccoMozambiqueNamibiaNepalNetherlandsNew ZealandNicaraguaNigeriaNorth AmericaNorwayOECD membersOmanOther small statesPacific island small statesPakistanParaguayPeruPhilippinesPolandPortugalPost-demographic dividendQatarRomaniaRussian FederationRwandaSamoaSan MarinoSao Tome and PrincipeSenegalSerbiaSierra LeoneSingaporeSlovak RepublicSmall statesSolomon IslandsSouth AfricaSouth AsiaSouth Asia (IDA & IBRD)SpainSri LankaSub-Saharan Africa Sub-Saharan Africa (excluding high income)Sub-Saharan Africa (IDA & IBRD countries)SurinameSwazilandSwedenSwitzerlandSyrian Arab RepublicThailandTimor-LesteTrinidad and TobagoTurkeyUgandaUkraineUnited Arab EmiratesUnited KingdomUnited StatesUruguayVanuatuVietnamWest Bank and GazaWorldYemen, Rep.Zimbabwe línea de tiempo (timeline):
En esta escala de tiempo se presenta un gráfico de 1973 y 2015 de France. Los datos de 1972 están ausentes. El número de observaciones reales por fecha: 43.
Fuente (nombre):
Indicadores del desarrollo mundial
Fuente (organización):
International Monetary Fund, Government Finance Statistics Yearbook and data files.
Categorías:
Public Sector
Se ha actualizado:
23 abr 2017 año
Los indicadores de los cambios de valor en los últimos años
Mínimo:
-6.851
1 ene 2010 año
Máximo:
1.591
1 ene 1974 año
A la fecha de observación
Valor
Cambio absoluto
El cambio con respecto al valor anterior
1 ene 1973 año
1.397
+1.397
0.0%
1 ene 1974 año
1.591
+0.194
13.85%
1 ene 1975 año
1.401
-0.19
-11.97%
1 ene 1976 año
-1.218
-2.618
-186.94%
1 ene 1977 año
0.608
+1.825
-149.92%
1 ene 1978 año
0.035
-0.573
-94.29%
1 ene 1979 año
-1.068
-1.103
-3.18 mil%
1 ene 1980 año
-0.088
+0.98
-91.78%
1 ene 1981 año
0.508
+0.596
-678.61%
1 ene 1982 año
-1.168
-1.676
-329.94%
1 ene 1983 año
-1.854
-0.686
58.73%
1 ene 1984 año
-2.342
-0.488
26.34%
1 ene 1985 año
-2.275
+0.067
-2.87%
1 ene 1986 año
-2.367
-0.092
4.06%
1 ene 1987 año
-2.343
+0.024
-1.03%
1 ene 1988 año
-1.643
+0.7
-29.87%
1 ene 1989 año
-1.389
+0.254
-15.47%
1 ene 1990 año
-1.012
+0.377
-27.15%
1 ene 1991 año
-1.393
-0.381
37.62%
1 ene 1992 año
-1.843
-0.45
32.31%
1 ene 1993 año
-3.513
-1.671
90.68%
1 ene 1994 año
-5.514
-2.001
56.95%
1 ene 1995 año
-5.473
+0.041
-0.75%
1 ene 1996 año
-4.822
+0.651
-11.89%
1 ene 1997 año
-3.837
+0.985
-20.43%
1 ene 1998 año
-3.751
+0.086
-2.25%
1 ene 1999 año
-2.613
+1.138
-30.33%
1 ene 2000 año
-1.793
+0.819
-31.36%
1 ene 2001 año
-1.408
+0.385
-21.48%
1 ene 2002 año
-1.51
-0.102
7.26%
1 ene 2003 año
-3.193
-1.683
111.41%
1 ene 2004 año
-3.898
-0.705
22.07%
1 ene 2005 año
-3.343
+0.555
-14.25%
1 ene 2006 año
-2.992
+0.351
-10.49%
1 ene 2007 año
-2.152
+0.84
-28.09%
1 ene 2008 año
-2.146
+0.006
-0.28%
1 ene 2009 año
-2.708
-0.562
26.2%
1 ene 2010 año
-6.851
-4.143
152.98%
1 ene 2011 año
-6.709
+0.142
-2.07%
1 ene 2012 año
-5.064
+1.645
-24.51%
1 ene 2013 año
-4.644
+0.42
-8.29%
1 ene 2014 año
-3.681
+0.963
-20.74%
1 ene 2015 año
-3.722
-0.041
1.12%
Ranking de los países por los datos estadísticos actuales


Comentarios: