29
/es/
es
AIzaSyAYiBZKx7MnpbEhh9jyipgxe19OcubqV5w
April 1, 2024
170286
Korea, Rep.
KOR
true
2
1
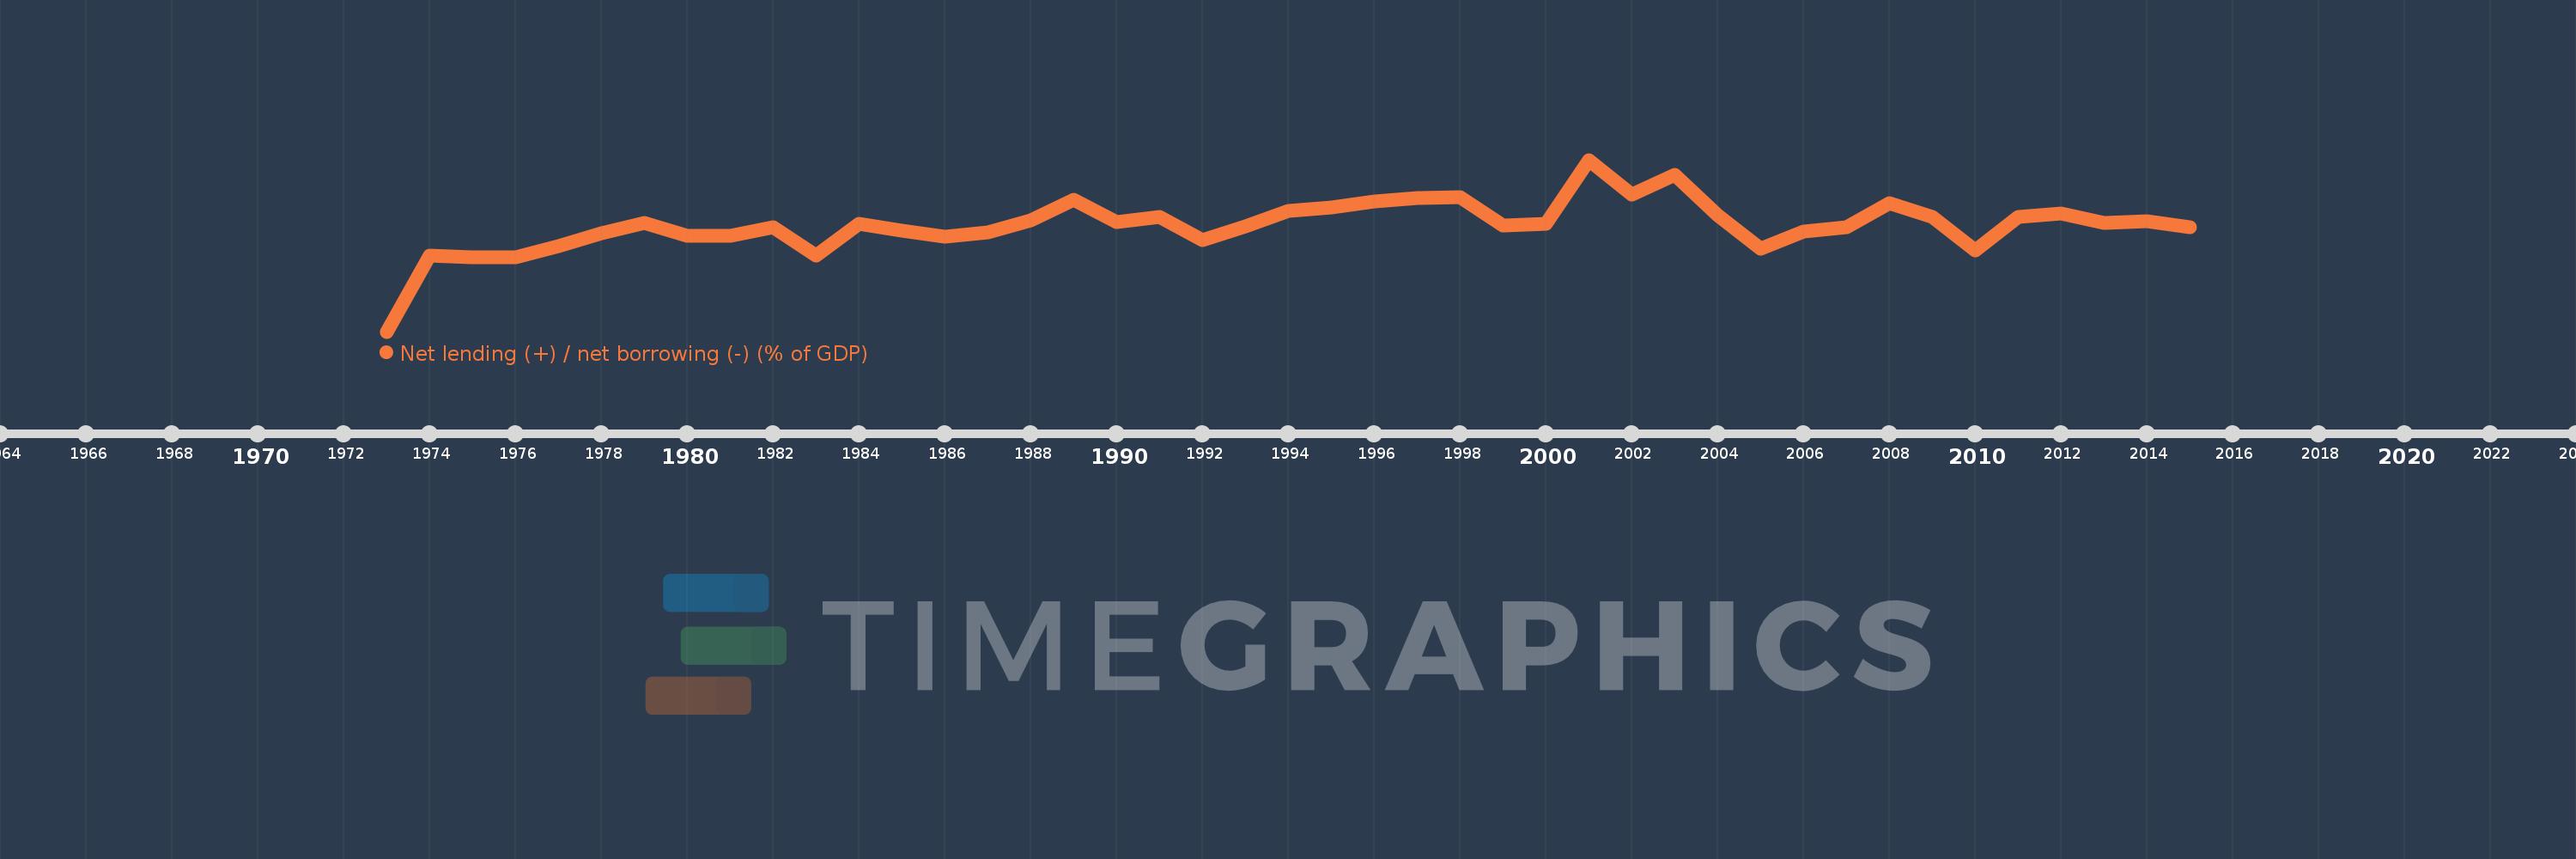
Net lending (+) / net borrowing (-) (% of GDP)
2015,2014,2013,2012,2011,2010,2009,2008,2007,2006,2005,2004,2003,2002,2001,2000,1999,1998,1997,1996,1995,1994,1993,1992,1991,1990,1989,1988,1987,1986,1985,1984,1983,1982,1981,1980,1979,1978,1977,1976,1975,1974,1973
Estas estadísticas en otros países:
AfghanistanAlbaniaAlgeriaAngolaAntigua and BarbudaArmeniaAustraliaAustriaAzerbaijanBahamas, TheBahrainBangladeshBarbadosBelarusBelgiumBelizeBhutanBoliviaBosnia and HerzegovinaBrazilBurundiCabo VerdeCambodiaCanadaCaribbean small statesCentral African RepublicCentral Europe and the BalticsChileCongo, Dem. Rep.Congo, Rep.Costa RicaCote d'IvoireCroatiaCyprusCzech RepublicDenmarkDominicaDominican RepublicEarly-demographic dividendEgypt, Arab Rep.El SalvadorEquatorial GuineaEstoniaEthiopiaEuro areaEurope & Central AsiaEurope & Central Asia (excluding high income)Europe & Central Asia (IDA & IBRD countries)European UnionFijiFinlandFranceGambia, TheGeorgiaGermanyGreeceGuatemalaHigh incomeHondurasHungaryIcelandIDA blendIndiaIndonesiaIran, Islamic Rep.IraqIrelandIsraelItalyJamaicaKazakhstanKiribatiKorea, Rep.Kyrgyz RepublicLao PDRLatin America & Caribbean Latin America & Caribbean (excluding high income)Latin America & the Caribbean (IDA & IBRD countries)LatviaLebanonLithuaniaLower middle incomeLuxembourgMacao SAR, ChinaMacedonia, FYRMadagascarMalawiMaldivesMaliMaltaMauritiusMexicoMicronesia, Fed. Sts.Middle East & North Africa (excluding high income)Middle East & North Africa (IDA & IBRD countries)MoldovaMongoliaMoroccoMozambiqueNamibiaNepalNetherlandsNew ZealandNicaraguaNigeriaNorth AmericaNorwayOECD membersOmanOther small statesPacific island small statesPakistanParaguayPeruPhilippinesPolandPortugalPost-demographic dividendQatarRomaniaRussian FederationRwandaSamoaSan MarinoSao Tome and PrincipeSenegalSerbiaSierra LeoneSingaporeSlovak RepublicSmall statesSolomon IslandsSouth AfricaSouth AsiaSouth Asia (IDA & IBRD)SpainSri LankaSub-Saharan Africa Sub-Saharan Africa (excluding high income)Sub-Saharan Africa (IDA & IBRD countries)SurinameSwazilandSwedenSwitzerlandSyrian Arab RepublicThailandTimor-LesteTrinidad and TobagoTurkeyUgandaUkraineUnited Arab EmiratesUnited KingdomUnited StatesUruguayVanuatuVietnamWest Bank and GazaWorldYemen, Rep.Zimbabwe línea de tiempo (timeline):
En esta escala de tiempo se presenta un gráfico de 1973 y 2015 de Korea, Rep.. Los datos de 1972 están ausentes. El número de observaciones reales por fecha: 43.
Fuente (nombre):
Indicadores del desarrollo mundial
Fuente (organización):
International Monetary Fund, Government Finance Statistics Yearbook and data files.
Categorías:
Public Sector
Se ha actualizado:
23 abr 2017 año
Los indicadores de los cambios de valor en los últimos años
Mínimo:
-3.717
1 ene 1973 año
Máximo:
4.154
1 ene 2001 año
A la fecha de observación
Valor
Cambio absoluto
El cambio con respecto al valor anterior
1 ene 1973 año
-3.717
-3.717
0.0%
1 ene 1974 año
-0.224
+3.492
-93.96%
1 ene 1975 año
-0.327
-0.102
45.57%
1 ene 1976 año
-0.326
+0.001
-0.16%
1 ene 1977 año
0.217
+0.544
-166.65%
1 ene 1978 año
0.79
+0.573
263.48%
1 ene 1979 año
1.245
+0.454
57.49%
1 ene 1980 año
0.655
-0.59
-47.4%
1 ene 1981 año
0.658
+0.003
0.49%
1 ene 1982 año
1.079
+0.421
63.91%
1 ene 1983 año
-0.221
-1.3
-120.51%
1 ene 1984 año
1.219
+1.44
-651.16%
1 ene 1985 año
0.905
-0.314
-25.79%
1 ene 1986 año
0.65
-0.254
-28.1%
1 ene 1987 año
0.845
+0.194
29.9%
1 ene 1988 año
1.38
+0.535
63.34%
1 ene 1989 año
2.322
+0.942
68.25%
1 ene 1990 año
1.309
-1.013
-43.64%
1 ene 1991 año
1.531
+0.222
16.97%
1 ene 1992 año
0.492
-1.039
-67.86%
1 ene 1993 año
1.09
+0.598
121.46%
1 ene 1994 año
1.824
+0.735
67.45%
1 ene 1995 año
1.96
+0.135
7.41%
1 ene 1996 año
2.264
+0.304
15.54%
1 ene 1997 año
2.405
+0.14
6.2%
1 ene 1998 año
2.433
+0.029
1.2%
1 ene 1999 año
1.151
-1.282
-52.7%
1 ene 2000 año
1.215
+0.064
5.52%
1 ene 2001 año
4.154
+2.94
242.06%
1 ene 2002 año
2.577
-1.578
-37.98%
1 ene 2003 año
3.446
+0.87
33.75%
1 ene 2004 año
1.615
-1.831
-53.14%
1 ene 2005 año
0.093
-1.522
-94.25%
1 ene 2006 año
0.857
+0.764
822.67%
1 ene 2007 año
1.075
+0.218
25.45%
1 ene 2008 año
2.167
+1.092
101.64%
1 ene 2009 año
1.523
-0.644
-29.74%
1 ene 2010 año
0.018
-1.505
-98.84%
1 ene 2011 año
1.533
+1.516
8.58 mil%
1 ene 2012 año
1.691
+0.158
10.28%
1 ene 2013 año
1.245
-0.446
-26.39%
1 ene 2014 año
1.351
+0.106
8.54%
1 ene 2015 año
1.05
-0.301
-22.28%
Ranking de los países por los datos estadísticos actuales


Comentarios: