29
/es/
es
AIzaSyAYiBZKx7MnpbEhh9jyipgxe19OcubqV5w
April 1, 2024
208249
Netherlands
NLD
true
2
1
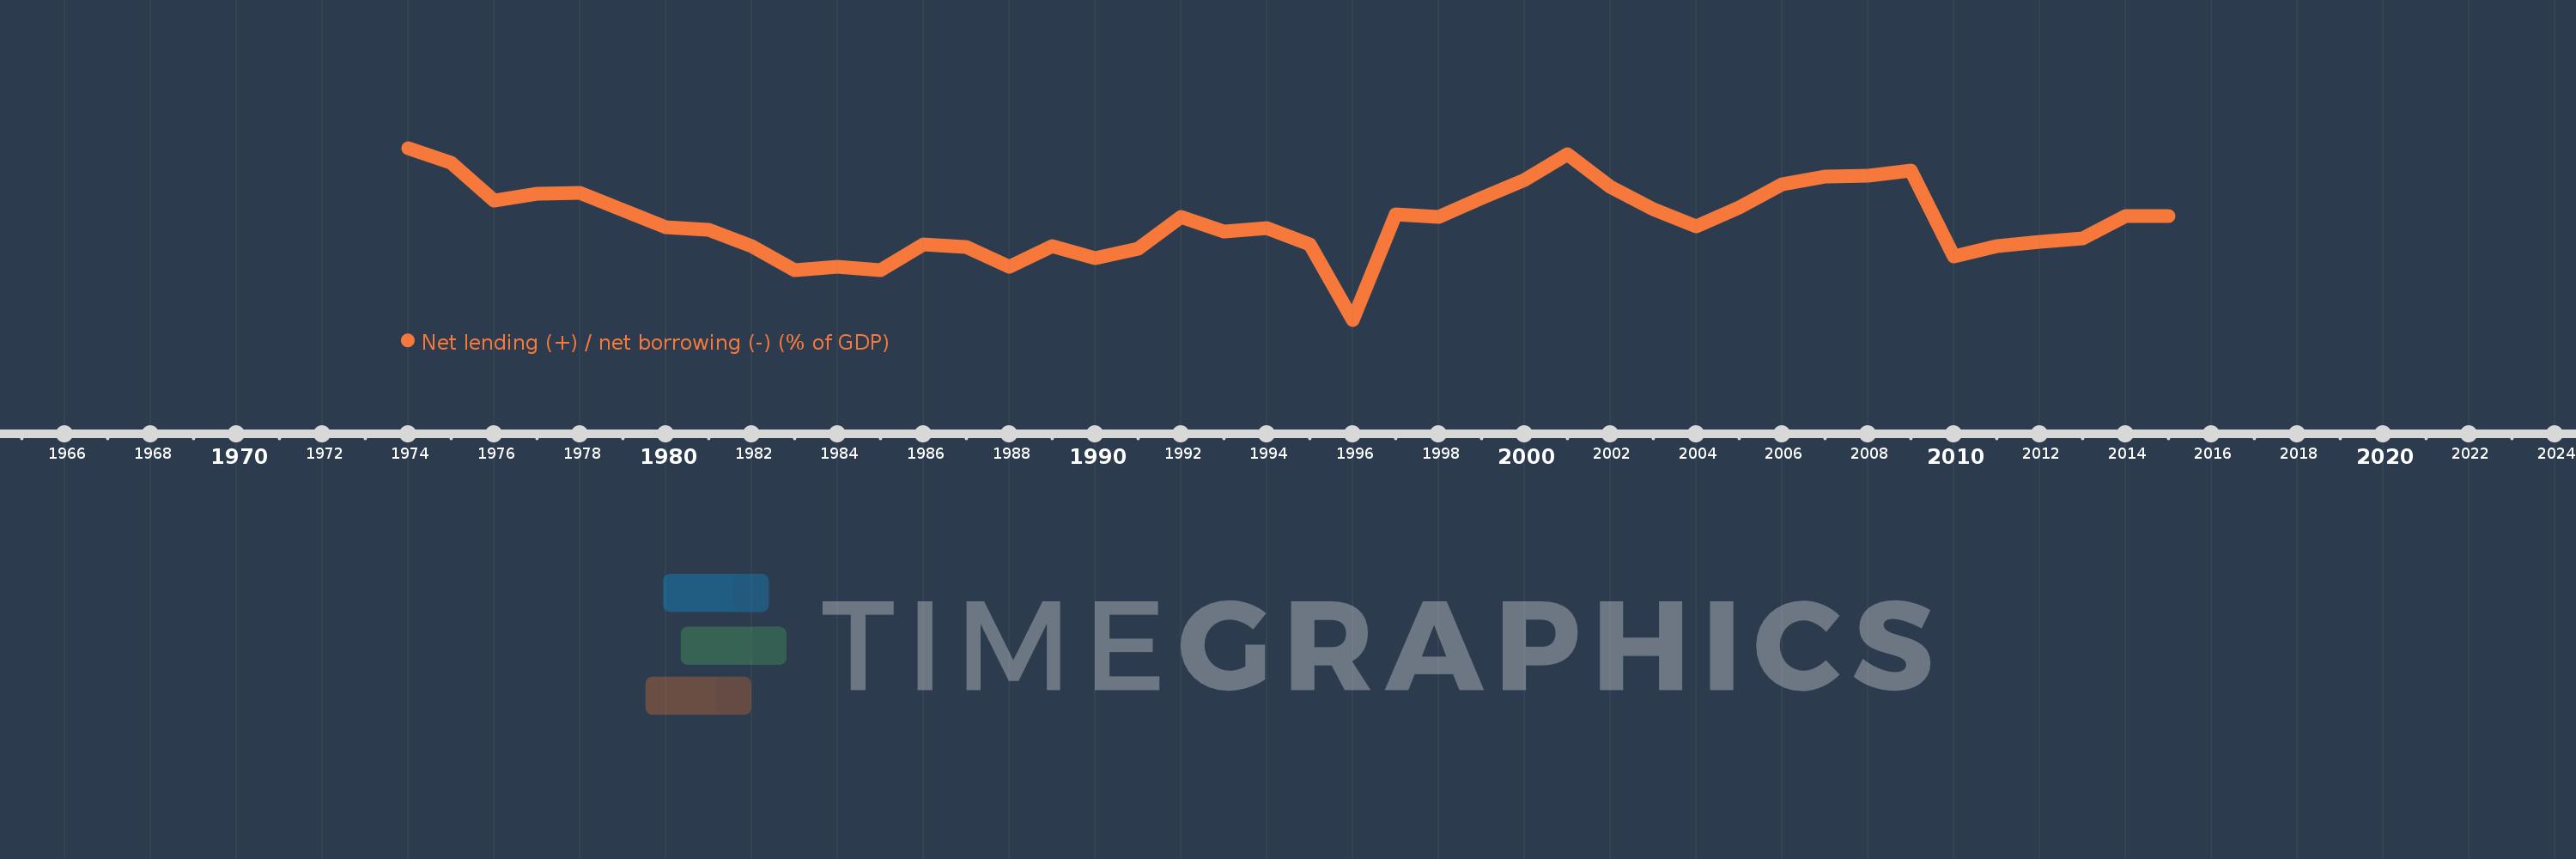
Net lending (+) / net borrowing (-) (% of GDP)
2015,2014,2013,2012,2011,2010,2009,2008,2007,2006,2005,2004,2003,2002,2001,2000,1999,1998,1997,1996,1995,1994,1993,1992,1991,1990,1989,1988,1987,1986,1985,1984,1983,1982,1981,1980,1979,1978,1977,1976,1975,1974
Estas estadísticas en otros países:
AfghanistanAlbaniaAlgeriaAngolaAntigua and BarbudaArmeniaAustraliaAustriaAzerbaijanBahamas, TheBahrainBangladeshBarbadosBelarusBelgiumBelizeBhutanBoliviaBosnia and HerzegovinaBrazilBurundiCabo VerdeCambodiaCanadaCaribbean small statesCentral African RepublicCentral Europe and the BalticsChileCongo, Dem. Rep.Congo, Rep.Costa RicaCote d'IvoireCroatiaCyprusCzech RepublicDenmarkDominicaDominican RepublicEarly-demographic dividendEgypt, Arab Rep.El SalvadorEquatorial GuineaEstoniaEthiopiaEuro areaEurope & Central AsiaEurope & Central Asia (excluding high income)Europe & Central Asia (IDA & IBRD countries)European UnionFijiFinlandFranceGambia, TheGeorgiaGermanyGreeceGuatemalaHigh incomeHondurasHungaryIcelandIDA blendIndiaIndonesiaIran, Islamic Rep.IraqIrelandIsraelItalyJamaicaKazakhstanKiribatiKorea, Rep.Kyrgyz RepublicLao PDRLatin America & Caribbean Latin America & Caribbean (excluding high income)Latin America & the Caribbean (IDA & IBRD countries)LatviaLebanonLithuaniaLower middle incomeLuxembourgMacao SAR, ChinaMacedonia, FYRMadagascarMalawiMaldivesMaliMaltaMauritiusMexicoMicronesia, Fed. Sts.Middle East & North Africa (excluding high income)Middle East & North Africa (IDA & IBRD countries)MoldovaMongoliaMoroccoMozambiqueNamibiaNepalNetherlandsNew ZealandNicaraguaNigeriaNorth AmericaNorwayOECD membersOmanOther small statesPacific island small statesPakistanParaguayPeruPhilippinesPolandPortugalPost-demographic dividendQatarRomaniaRussian FederationRwandaSamoaSan MarinoSao Tome and PrincipeSenegalSerbiaSierra LeoneSingaporeSlovak RepublicSmall statesSolomon IslandsSouth AfricaSouth AsiaSouth Asia (IDA & IBRD)SpainSri LankaSub-Saharan Africa Sub-Saharan Africa (excluding high income)Sub-Saharan Africa (IDA & IBRD countries)SurinameSwazilandSwedenSwitzerlandSyrian Arab RepublicThailandTimor-LesteTrinidad and TobagoTurkeyUgandaUkraineUnited Arab EmiratesUnited KingdomUnited StatesUruguayVanuatuVietnamWest Bank and GazaWorldYemen, Rep.Zimbabwe línea de tiempo (timeline):
En esta escala de tiempo se presenta un gráfico de 1974 y 2015 de Netherlands. Los datos de 1973 están ausentes. El número de observaciones reales por fecha: 42.
Fuente (nombre):
Indicadores del desarrollo mundial
Fuente (organización):
International Monetary Fund, Government Finance Statistics Yearbook and data files.
Categorías:
Public Sector
Se ha actualizado:
23 abr 2017 año
Los indicadores de los cambios de valor en los últimos años
Mínimo:
-8.593
1 ene 1996 año
Máximo:
2.31
1 ene 1974 año
A la fecha de observación
Valor
Cambio absoluto
El cambio con respecto al valor anterior
1 ene 1974 año
2.31
+2.31
0.0%
1 ene 1975 año
1.378
-0.932
-40.36%
1 ene 1976 año
-1.011
-2.389
-173.37%
1 ene 1977 año
-0.604
+0.407
-40.29%
1 ene 1978 año
-0.523
+0.08
-13.33%
1 ene 1979 año
-1.613
-1.09
208.33%
1 ene 1980 año
-2.74
-1.127
69.87%
1 ene 1981 año
-2.872
-0.132
4.8%
1 ene 1982 año
-3.94
-1.068
37.2%
1 ene 1983 año
-5.45
-1.51
38.34%
1 ene 1984 año
-5.209
+0.242
-4.43%
1 ene 1985 año
-5.473
-0.264
5.07%
1 ene 1986 año
-3.812
+1.661
-30.35%
1 ene 1987 año
-3.979
-0.167
4.37%
1 ene 1988 año
-5.232
-1.254
31.51%
1 ene 1989 año
-3.908
+1.325
-25.32%
1 ene 1990 año
-4.707
-0.8
20.47%
1 ene 1991 año
-4.094
+0.613
-13.02%
1 ene 1992 año
-2.076
+2.018
-49.29%
1 ene 1993 año
-3.02
-0.944
45.46%
1 ene 1994 año
-2.784
+0.236
-7.8%
1 ene 1995 año
-3.814
-1.029
36.97%
1 ene 1996 año
-8.593
-4.779
125.32%
1 ene 1997 año
-1.888
+6.705
-78.03%
1 ene 1998 año
-2.046
-0.158
8.36%
1 ene 1999 año
-0.895
+1.151
-56.26%
1 ene 2000 año
0.256
+1.151
-128.61%
1 ene 2001 año
1.914
+1.658
647.48%
1 ene 2002 año
-0.168
-2.081
-108.76%
1 ene 2003 año
-1.565
-1.397
833.59%
1 ene 2004 año
-2.646
-1.082
69.13%
1 ene 2005 año
-1.453
+1.194
-45.11%
1 ene 2006 año
0.002
+1.455
-100.15%
1 ene 2007 año
0.474
+0.472
21.46 mil%
1 ene 2008 año
0.576
+0.101
21.37%
1 ene 2009 año
0.903
+0.328
56.92%
1 ene 2010 año
-4.582
-5.485
-607.27%
1 ene 2011 año
-3.935
+0.646
-14.11%
1 ene 2012 año
-3.634
+0.302
-7.67%
1 ene 2013 año
-3.438
+0.195
-5.38%
1 ene 2014 año
-2.024
+1.414
-41.12%
1 ene 2015 año
-2.018
+0.007
-0.33%
Ranking de los países por los datos estadísticos actuales


Comentarios: