29
/es/
es
AIzaSyAYiBZKx7MnpbEhh9jyipgxe19OcubqV5w
April 1, 2024
161787
Italy
ITA
true
2
1
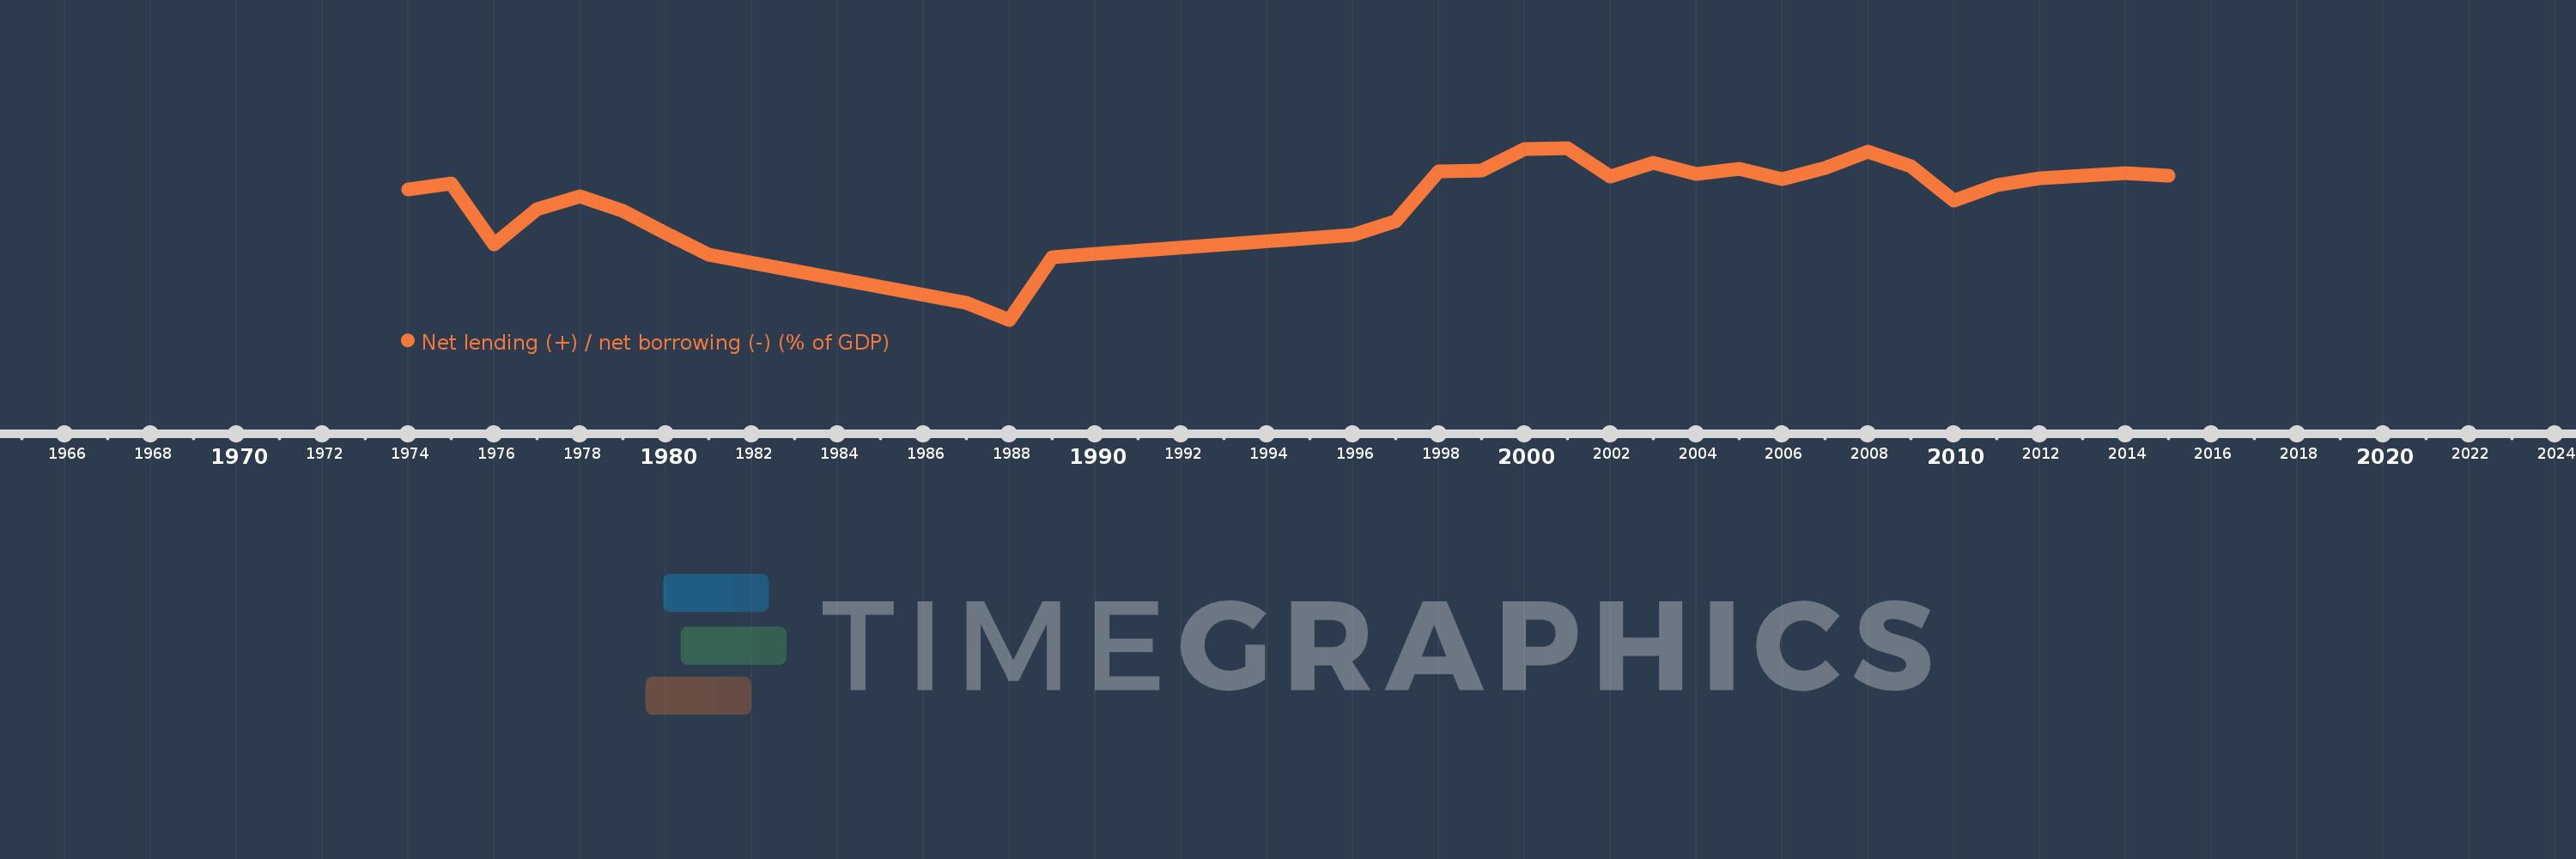
Net lending (+) / net borrowing (-) (% of GDP)
2015,2014,2013,2012,2011,2010,2009,2008,2007,2006,2005,2004,2003,2002,2001,2000,1999,1998,1997,1996,1990,1989,1988,1987,1981,1980,1979,1978,1977,1976,1975,1974
Estas estadísticas en otros países:
AfghanistanAlbaniaAlgeriaAngolaAntigua and BarbudaArmeniaAustraliaAustriaAzerbaijanBahamas, TheBahrainBangladeshBarbadosBelarusBelgiumBelizeBhutanBoliviaBosnia and HerzegovinaBrazilBurundiCabo VerdeCambodiaCanadaCaribbean small statesCentral African RepublicCentral Europe and the BalticsChileCongo, Dem. Rep.Congo, Rep.Costa RicaCote d'IvoireCroatiaCyprusCzech RepublicDenmarkDominicaDominican RepublicEarly-demographic dividendEgypt, Arab Rep.El SalvadorEquatorial GuineaEstoniaEthiopiaEuro areaEurope & Central AsiaEurope & Central Asia (excluding high income)Europe & Central Asia (IDA & IBRD countries)European UnionFijiFinlandFranceGambia, TheGeorgiaGermanyGreeceGuatemalaHigh incomeHondurasHungaryIcelandIDA blendIndiaIndonesiaIran, Islamic Rep.IraqIrelandIsraelItalyJamaicaKazakhstanKiribatiKorea, Rep.Kyrgyz RepublicLao PDRLatin America & Caribbean Latin America & Caribbean (excluding high income)Latin America & the Caribbean (IDA & IBRD countries)LatviaLebanonLithuaniaLower middle incomeLuxembourgMacao SAR, ChinaMacedonia, FYRMadagascarMalawiMaldivesMaliMaltaMauritiusMexicoMicronesia, Fed. Sts.Middle East & North Africa (excluding high income)Middle East & North Africa (IDA & IBRD countries)MoldovaMongoliaMoroccoMozambiqueNamibiaNepalNetherlandsNew ZealandNicaraguaNigeriaNorth AmericaNorwayOECD membersOmanOther small statesPacific island small statesPakistanParaguayPeruPhilippinesPolandPortugalPost-demographic dividendQatarRomaniaRussian FederationRwandaSamoaSan MarinoSao Tome and PrincipeSenegalSerbiaSierra LeoneSingaporeSlovak RepublicSmall statesSolomon IslandsSouth AfricaSouth AsiaSouth Asia (IDA & IBRD)SpainSri LankaSub-Saharan Africa Sub-Saharan Africa (excluding high income)Sub-Saharan Africa (IDA & IBRD countries)SurinameSwazilandSwedenSwitzerlandSyrian Arab RepublicThailandTimor-LesteTrinidad and TobagoTurkeyUgandaUkraineUnited Arab EmiratesUnited KingdomUnited StatesUruguayVanuatuVietnamWest Bank and GazaWorldYemen, Rep.Zimbabwe línea de tiempo (timeline):
En esta escala de tiempo se presenta un gráfico de 1974 y 2015 de Italy. Los datos de 1973 están ausentes. El número de observaciones reales por fecha: 32.
Fuente (nombre):
Indicadores del desarrollo mundial
Fuente (organización):
International Monetary Fund, Government Finance Statistics Yearbook and data files.
Categorías:
Public Sector
Se ha actualizado:
23 abr 2017 año
Los indicadores de los cambios de valor en los últimos años
Mínimo:
-13.301
1 ene 1988 año
Máximo:
-1.168
1 ene 2001 año
A la fecha de observación
Valor
Cambio absoluto
El cambio con respecto al valor anterior
1 ene 1974 año
-4.069
-4.069
0.0%
1 ene 1975 año
-3.695
+0.374
-9.18%
1 ene 1976 año
-7.999
-4.304
116.5%
1 ene 1977 año
-5.5
+2.499
-31.24%
1 ene 1978 año
-4.562
+0.938
-17.05%
1 ene 1979 año
-5.624
-1.062
23.28%
1 ene 1980 año
-7.193
-1.569
27.89%
1 ene 1981 año
-8.72
-1.527
21.23%
1 ene 1987 año
-12.113
-3.393
38.91%
1 ene 1988 año
-13.301
-1.188
9.81%
1 ene 1989 año
-8.906
+4.395
-33.05%
1 ene 1990 año
-8.634
+0.271
-3.05%
1 ene 1996 año
-7.324
+1.31
-15.18%
1 ene 1997 año
-6.347
+0.977
-13.34%
1 ene 1998 año
-2.844
+3.503
-55.2%
1 ene 1999 año
-2.775
+0.068
-2.4%
1 ene 2000 año
-1.222
+1.553
-55.97%
1 ene 2001 año
-1.168
+0.054
-4.43%
1 ene 2002 año
-3.184
-2.016
172.64%
1 ene 2003 año
-2.243
+0.941
-29.54%
1 ene 2004 año
-2.988
-0.744
33.18%
1 ene 2005 año
-2.628
+0.36
-12.03%
1 ene 2006 año
-3.374
-0.746
28.38%
1 ene 2007 año
-2.594
+0.78
-23.12%
1 ene 2008 año
-1.449
+1.145
-44.14%
1 ene 2009 año
-2.45
-1.001
69.07%
1 ene 2010 año
-4.899
-2.449
99.96%
1 ene 2011 año
-3.797
+1.102
-22.49%
1 ene 2012 año
-3.294
+0.503
-13.25%
1 ene 2013 año
-3.154
+0.14
-4.24%
1 ene 2014 año
-2.923
+0.231
-7.32%
1 ene 2015 año
-3.147
-0.224
7.66%
Ranking de los países por los datos estadísticos actuales


Comentarios: