29
/es/
es
AIzaSyAYiBZKx7MnpbEhh9jyipgxe19OcubqV5w
April 1, 2024
118238
Czech Republic
CZE
true
2
1
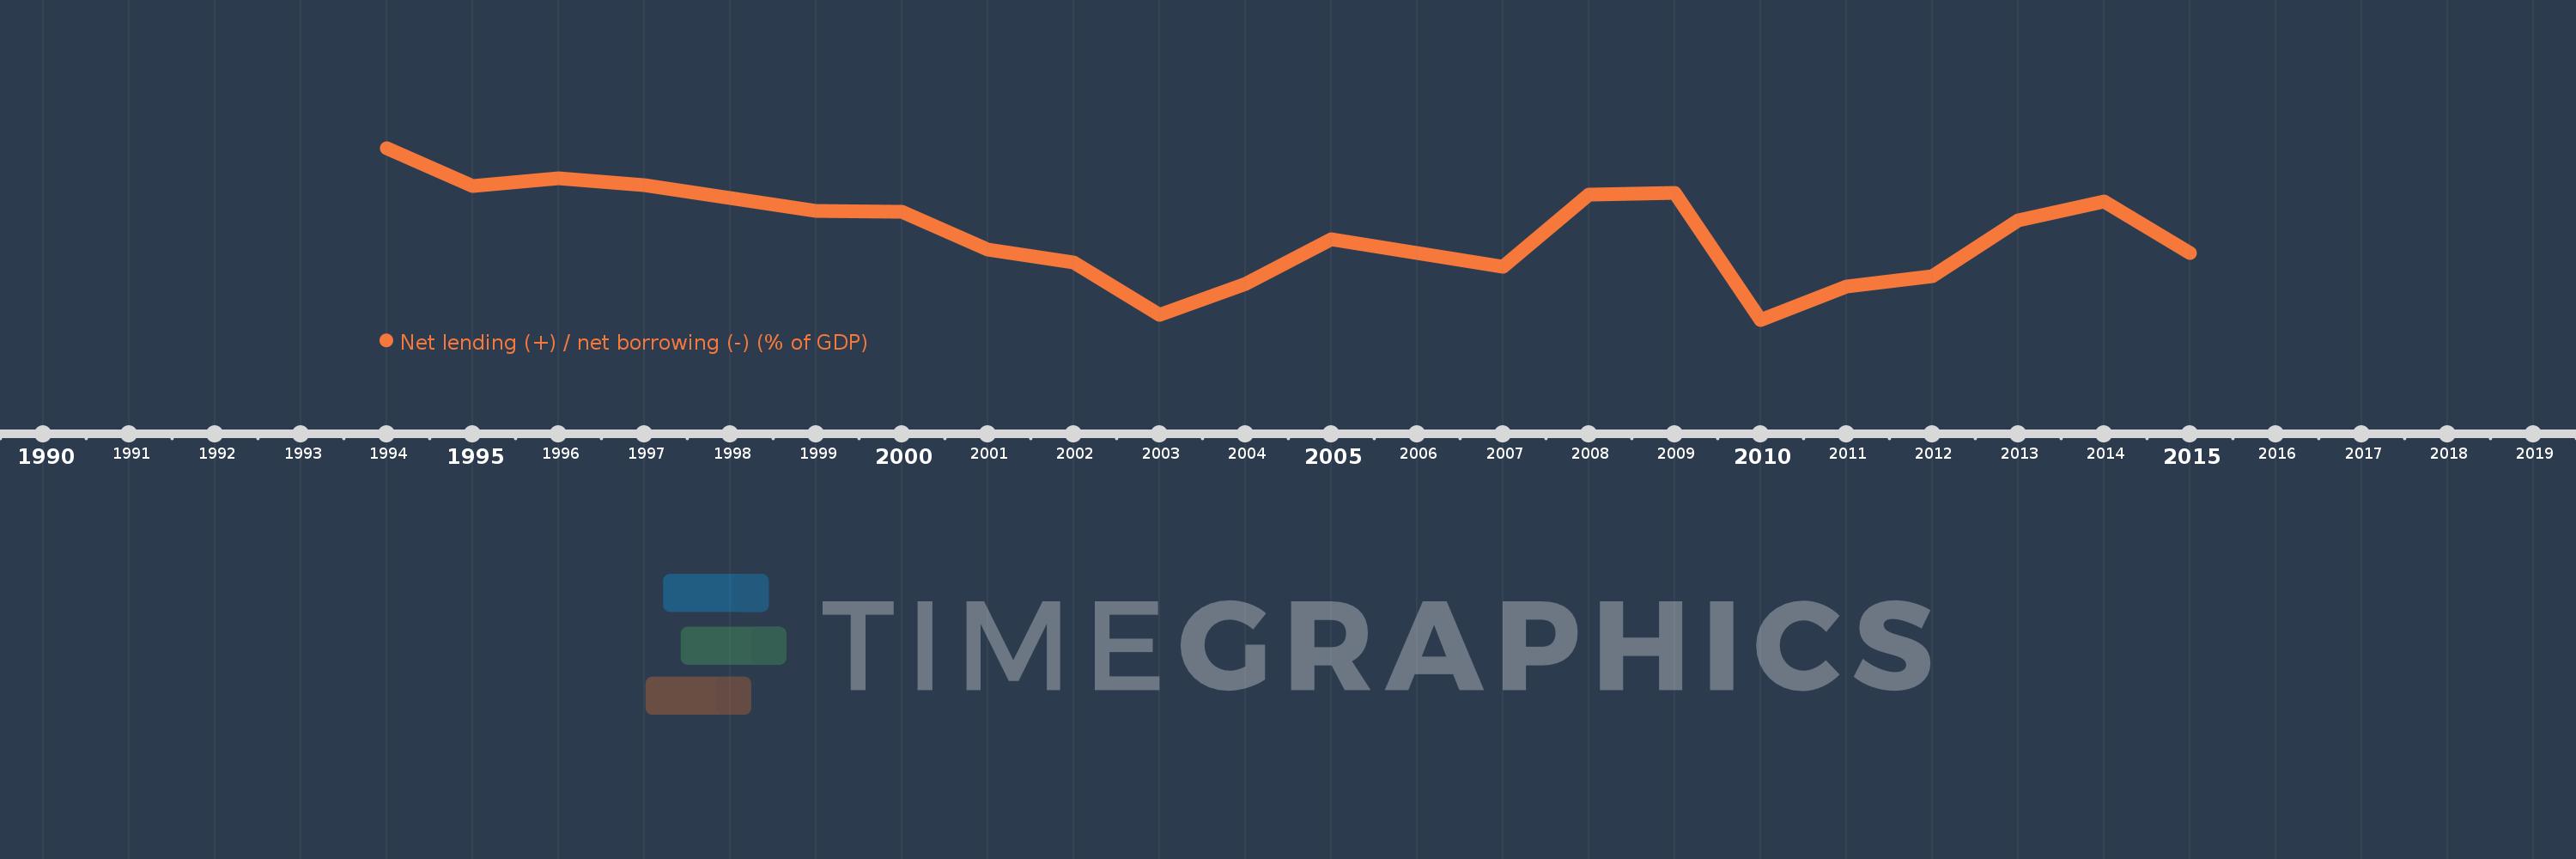
Net lending (+) / net borrowing (-) (% of GDP)
2015,2014,2013,2012,2011,2010,2009,2008,2007,2006,2005,2004,2003,2002,2001,2000,1999,1998,1997,1996,1995,1994
Estas estadísticas en otros países:
AfghanistanAlbaniaAlgeriaAngolaAntigua and BarbudaArmeniaAustraliaAustriaAzerbaijanBahamas, TheBahrainBangladeshBarbadosBelarusBelgiumBelizeBhutanBoliviaBosnia and HerzegovinaBrazilBurundiCabo VerdeCambodiaCanadaCaribbean small statesCentral African RepublicCentral Europe and the BalticsChileCongo, Dem. Rep.Congo, Rep.Costa RicaCote d'IvoireCroatiaCyprusCzech RepublicDenmarkDominicaDominican RepublicEarly-demographic dividendEgypt, Arab Rep.El SalvadorEquatorial GuineaEstoniaEthiopiaEuro areaEurope & Central AsiaEurope & Central Asia (excluding high income)Europe & Central Asia (IDA & IBRD countries)European UnionFijiFinlandFranceGambia, TheGeorgiaGermanyGreeceGuatemalaHigh incomeHondurasHungaryIcelandIDA blendIndiaIndonesiaIran, Islamic Rep.IraqIrelandIsraelItalyJamaicaKazakhstanKiribatiKorea, Rep.Kyrgyz RepublicLao PDRLatin America & Caribbean Latin America & Caribbean (excluding high income)Latin America & the Caribbean (IDA & IBRD countries)LatviaLebanonLithuaniaLower middle incomeLuxembourgMacao SAR, ChinaMacedonia, FYRMadagascarMalawiMaldivesMaliMaltaMauritiusMexicoMicronesia, Fed. Sts.Middle East & North Africa (excluding high income)Middle East & North Africa (IDA & IBRD countries)MoldovaMongoliaMoroccoMozambiqueNamibiaNepalNetherlandsNew ZealandNicaraguaNigeriaNorth AmericaNorwayOECD membersOmanOther small statesPacific island small statesPakistanParaguayPeruPhilippinesPolandPortugalPost-demographic dividendQatarRomaniaRussian FederationRwandaSamoaSan MarinoSao Tome and PrincipeSenegalSerbiaSierra LeoneSingaporeSlovak RepublicSmall statesSolomon IslandsSouth AfricaSouth AsiaSouth Asia (IDA & IBRD)SpainSri LankaSub-Saharan Africa Sub-Saharan Africa (excluding high income)Sub-Saharan Africa (IDA & IBRD countries)SurinameSwazilandSwedenSwitzerlandSyrian Arab RepublicThailandTimor-LesteTrinidad and TobagoTurkeyUgandaUkraineUnited Arab EmiratesUnited KingdomUnited StatesUruguayVanuatuVietnamWest Bank and GazaWorldYemen, Rep.Zimbabwe línea de tiempo (timeline):
En esta escala de tiempo se presenta un gráfico de 1994 y 2015 de Czech Republic. Los datos de 1993 están ausentes. El número de observaciones reales por fecha: 22.
Fuente (nombre):
Indicadores del desarrollo mundial
Fuente (organización):
International Monetary Fund, Government Finance Statistics Yearbook and data files.
Categorías:
Public Sector
Se ha actualizado:
23 abr 2017 año
Los indicadores de los cambios de valor en los últimos años
Mínimo:
-5.682
1 ene 2010 año
Máximo:
0.145
1 ene 1994 año
A la fecha de observación
Valor
Cambio absoluto
El cambio con respecto al valor anterior
1 ene 1994 año
0.145
+0.145
0.0%
1 ene 1995 año
-1.143
-1.288
-887.73%
1 ene 1996 año
-0.871
+0.272
-23.79%
1 ene 1997 año
-1.111
-0.24
27.52%
1 ene 1998 año
-1.55
-0.439
39.56%
1 ene 1999 año
-1.984
-0.434
27.98%
1 ene 2000 año
-2.014
-0.03
1.51%
1 ene 2001 año
-3.311
-1.297
64.42%
1 ene 2002 año
-3.734
-0.423
12.78%
1 ene 2003 año
-5.527
-1.793
48.01%
1 ene 2004 año
-4.471
+1.056
-19.11%
1 ene 2005 año
-2.943
+1.528
-34.18%
1 ene 2006 año
-3.413
-0.47
15.97%
1 ene 2007 año
-3.882
-0.469
13.74%
1 ene 2008 año
-1.442
+2.44
-62.86%
1 ene 2009 año
-1.374
+0.068
-4.7%
1 ene 2010 año
-5.682
-4.308
313.6%
1 ene 2011 año
-4.548
+1.134
-19.96%
1 ene 2012 año
-4.214
+0.334
-7.35%
1 ene 2013 año
-2.324
+1.89
-44.86%
1 ene 2014 año
-1.669
+0.655
-28.19%
1 ene 2015 año
-3.414
-1.745
104.59%
Ranking de los países por los datos estadísticos actuales


Comentarios: