29
/es/
es
AIzaSyAYiBZKx7MnpbEhh9jyipgxe19OcubqV5w
April 1, 2024
228878
Romania
ROU
true
2
1
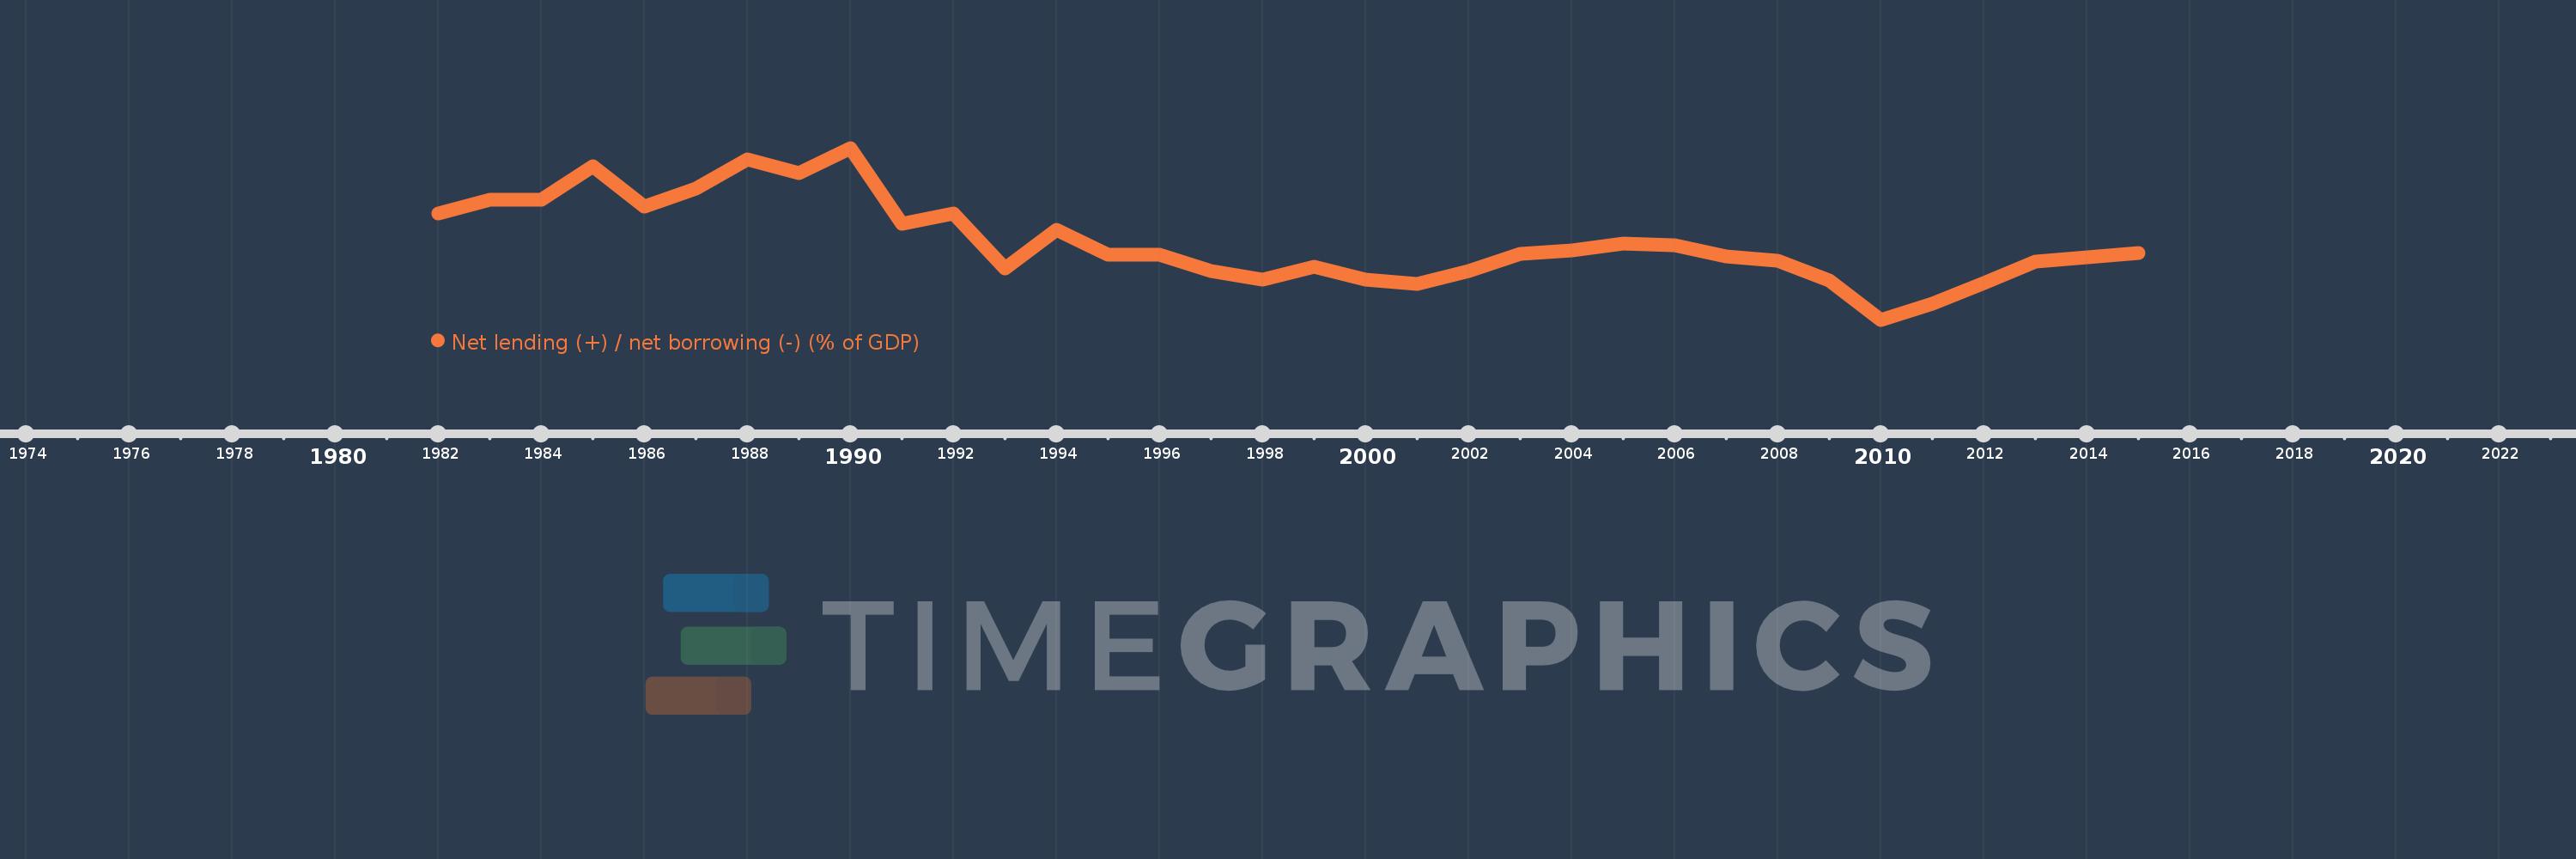
Net lending (+) / net borrowing (-) (% of GDP)
2015,2014,2013,2012,2011,2010,2009,2008,2007,2006,2005,2004,2003,2002,2001,2000,1999,1998,1997,1996,1995,1994,1993,1992,1991,1990,1989,1988,1987,1986,1985,1984,1983,1982
Estas estadísticas en otros países:
AfghanistanAlbaniaAlgeriaAngolaAntigua and BarbudaArmeniaAustraliaAustriaAzerbaijanBahamas, TheBahrainBangladeshBarbadosBelarusBelgiumBelizeBhutanBoliviaBosnia and HerzegovinaBrazilBurundiCabo VerdeCambodiaCanadaCaribbean small statesCentral African RepublicCentral Europe and the BalticsChileCongo, Dem. Rep.Congo, Rep.Costa RicaCote d'IvoireCroatiaCyprusCzech RepublicDenmarkDominicaDominican RepublicEarly-demographic dividendEgypt, Arab Rep.El SalvadorEquatorial GuineaEstoniaEthiopiaEuro areaEurope & Central AsiaEurope & Central Asia (excluding high income)Europe & Central Asia (IDA & IBRD countries)European UnionFijiFinlandFranceGambia, TheGeorgiaGermanyGreeceGuatemalaHigh incomeHondurasHungaryIcelandIDA blendIndiaIndonesiaIran, Islamic Rep.IraqIrelandIsraelItalyJamaicaKazakhstanKiribatiKorea, Rep.Kyrgyz RepublicLao PDRLatin America & Caribbean Latin America & Caribbean (excluding high income)Latin America & the Caribbean (IDA & IBRD countries)LatviaLebanonLithuaniaLower middle incomeLuxembourgMacao SAR, ChinaMacedonia, FYRMadagascarMalawiMaldivesMaliMaltaMauritiusMexicoMicronesia, Fed. Sts.Middle East & North Africa (excluding high income)Middle East & North Africa (IDA & IBRD countries)MoldovaMongoliaMoroccoMozambiqueNamibiaNepalNetherlandsNew ZealandNicaraguaNigeriaNorth AmericaNorwayOECD membersOmanOther small statesPacific island small statesPakistanParaguayPeruPhilippinesPolandPortugalPost-demographic dividendQatarRomaniaRussian FederationRwandaSamoaSan MarinoSao Tome and PrincipeSenegalSerbiaSierra LeoneSingaporeSlovak RepublicSmall statesSolomon IslandsSouth AfricaSouth AsiaSouth Asia (IDA & IBRD)SpainSri LankaSub-Saharan Africa Sub-Saharan Africa (excluding high income)Sub-Saharan Africa (IDA & IBRD countries)SurinameSwazilandSwedenSwitzerlandSyrian Arab RepublicThailandTimor-LesteTrinidad and TobagoTurkeyUgandaUkraineUnited Arab EmiratesUnited KingdomUnited StatesUruguayVanuatuVietnamWest Bank and GazaWorldYemen, Rep.Zimbabwe línea de tiempo (timeline):
En esta escala de tiempo se presenta un gráfico de 1982 y 2015 de Romania. Los datos de 1981 están ausentes. El número de observaciones reales por fecha: 34.
Fuente (nombre):
Indicadores del desarrollo mundial
Fuente (organización):
International Monetary Fund, Government Finance Statistics Yearbook and data files.
Categorías:
Public Sector
Se ha actualizado:
23 abr 2017 año
Los indicadores de los cambios de valor en los últimos años
Mínimo:
-8.366
1 ene 2010 año
Máximo:
8.288
1 ene 1990 año
A la fecha de observación
Valor
Cambio absoluto
El cambio con respecto al valor anterior
1 ene 1982 año
1.935
+1.935
0.0%
1 ene 1983 año
3.275
+1.34
69.22%
1 ene 1984 año
3.287
+0.013
0.39%
1 ene 1985 año
6.548
+3.261
99.19%
1 ene 1986 año
2.596
-3.952
-60.36%
1 ene 1987 año
4.341
+1.745
67.23%
1 ene 1988 año
7.154
+2.812
64.78%
1 ene 1989 año
5.889
-1.265
-17.68%
1 ene 1990 año
8.288
+2.399
40.74%
1 ene 1991 año
0.937
-7.351
-88.69%
1 ene 1992 año
1.943
+1.006
107.37%
1 ene 1993 año
-3.409
-5.353
-275.44%
1 ene 1994 año
0.386
+3.796
-111.33%
1 ene 1995 año
-2.067
-2.453
-634.98%
1 ene 1996 año
-2.073
-0.006
0.28%
1 ene 1997 año
-3.661
-1.588
76.64%
1 ene 1998 año
-4.437
-0.776
21.2%
1 ene 1999 año
-3.205
+1.232
-27.76%
1 ene 2000 año
-4.518
-1.312
40.94%
1 ene 2001 año
-4.932
-0.414
9.17%
1 ene 2002 año
-3.665
+1.267
-25.69%
1 ene 2003 año
-1.99
+1.675
-45.7%
1 ene 2004 año
-1.659
+0.331
-16.62%
1 ene 2005 año
-1.017
+0.642
-38.69%
1 ene 2006 año
-1.126
-0.109
10.72%
1 ene 2007 año
-2.229
-1.103
97.87%
1 ene 2008 año
-2.661
-0.432
19.38%
1 ene 2009 año
-4.543
-1.882
70.72%
1 ene 2010 año
-8.366
-3.824
84.17%
1 ene 2011 año
-6.778
+1.588
-18.98%
1 ene 2012 año
-4.801
+1.977
-29.17%
1 ene 2013 año
-2.695
+2.106
-43.87%
1 ene 2014 año
-2.282
+0.412
-15.3%
1 ene 2015 año
-1.887
+0.395
-17.33%
Ranking de los países por los datos estadísticos actuales


Comentarios: