29
/es/
es
AIzaSyAYiBZKx7MnpbEhh9jyipgxe19OcubqV5w
April 1, 2024
211180
Nicaragua
NIC
true
2
1
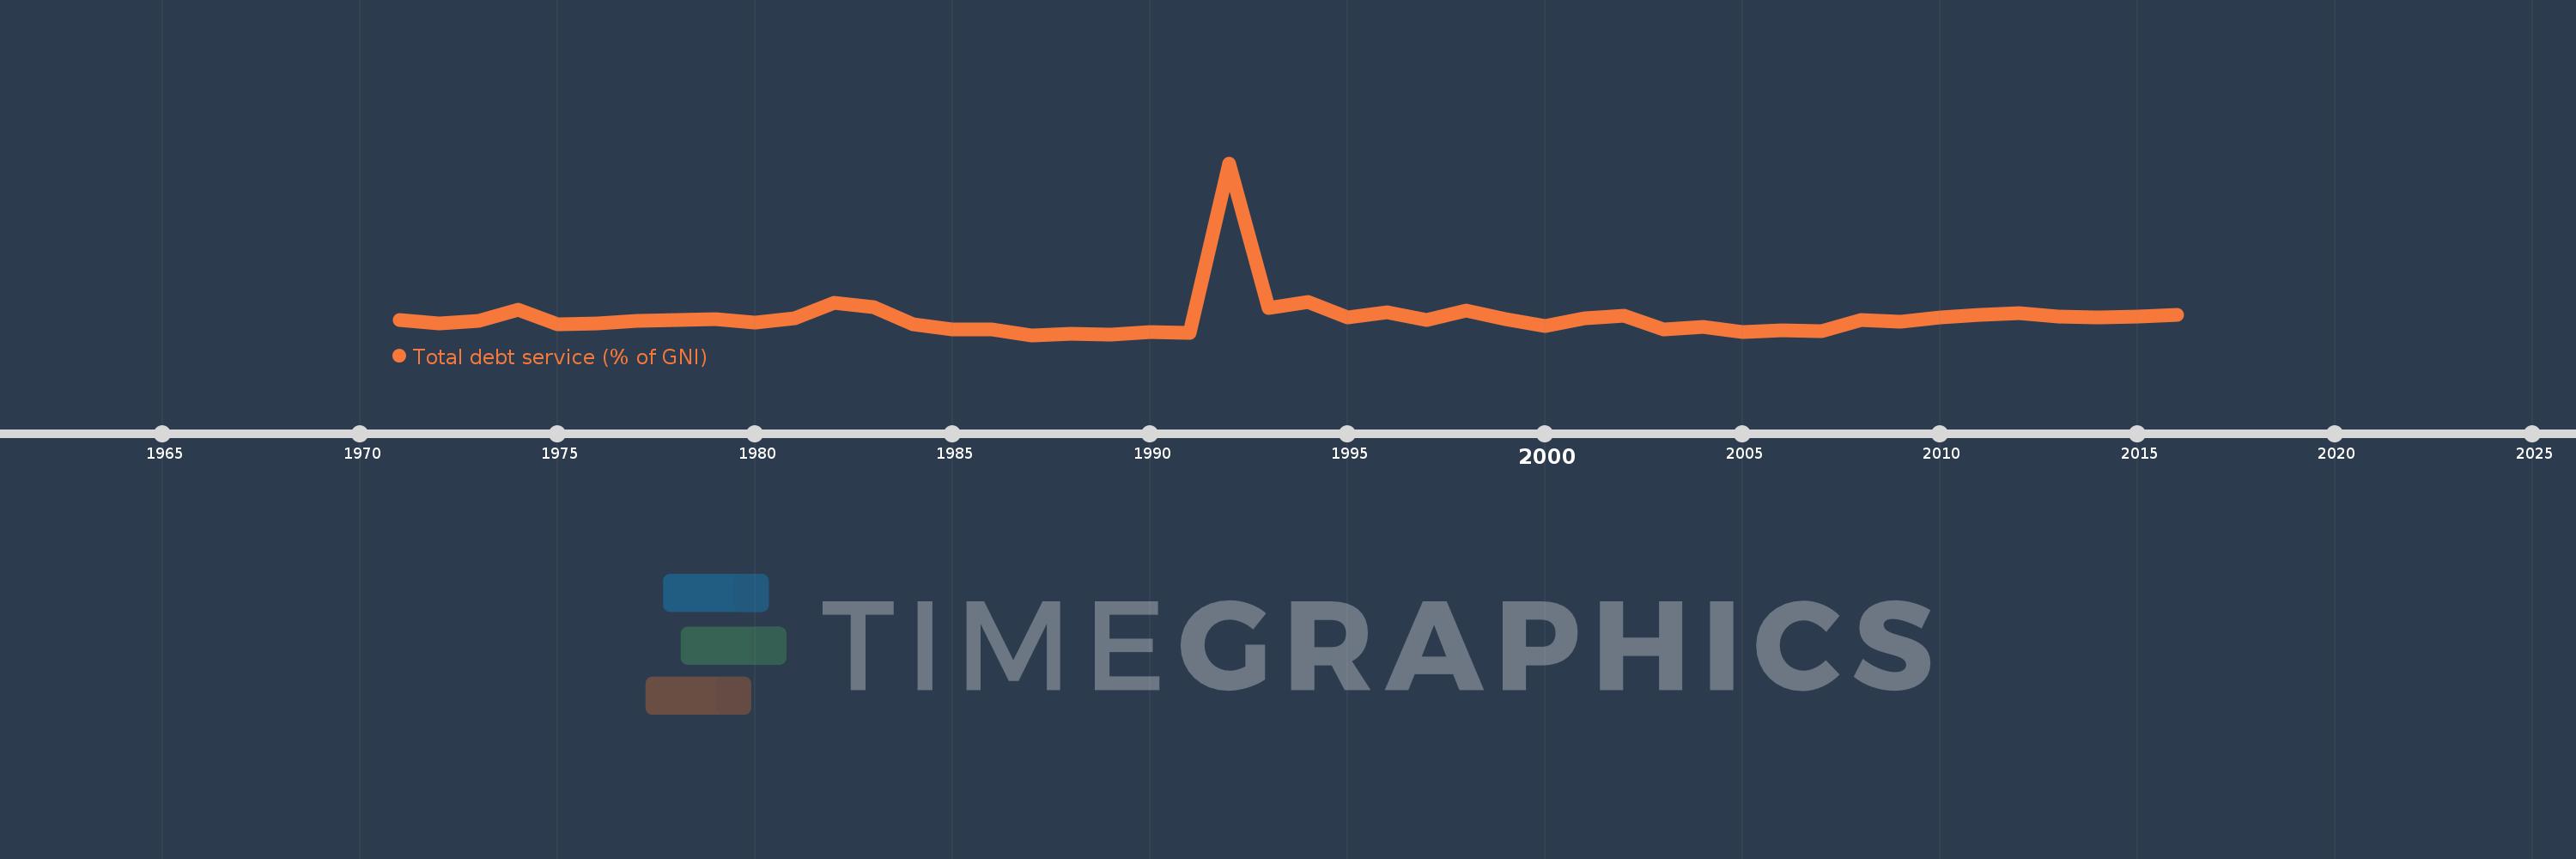
Total debt service (% of GNI)
2016,2015,2014,2013,2012,2011,2010,2009,2008,2007,2006,2005,2004,2003,2002,2001,2000,1999,1998,1997,1996,1995,1994,1993,1992,1991,1990,1989,1988,1987,1986,1985,1984,1983,1982,1981,1980,1979,1978,1977,1976,1975,1974,1973,1972,1971
Estas estadísticas en otros países:
línea de tiempo (timeline):
En esta escala de tiempo se presenta un gráfico de 1971 y 2016 de Nicaragua. Los datos de 1970 están ausentes. El número de observaciones reales por fecha: 46.
Fuente (nombre):
Indicadores del desarrollo mundial
Fuente (organización):
World Bank, International Debt Statistics.
Categorías:
Economy & Growth, External Debt
Se ha actualizado:
23 abr 2017 año
Los indicadores de los cambios de valor en los últimos años
Mínimo:
1.564
1 ene 1987 año
Máximo:
47.109
1 ene 1992 año
A la fecha de observación
Valor
Cambio absoluto
El cambio con respecto al valor anterior
1 ene 1971 año
5.519
+5.519
0.0%
1 ene 1972 año
4.557
-0.962
-17.43%
1 ene 1973 año
5.318
+0.761
16.7%
1 ene 1974 año
8.275
+2.957
55.6%
1 ene 1975 año
4.394
-3.881
-46.9%
1 ene 1976 año
4.717
+0.322
7.34%
1 ene 1977 año
5.271
+0.555
11.76%
1 ene 1978 año
5.448
+0.177
3.36%
1 ene 1979 año
5.766
+0.317
5.83%
1 ene 1980 año
4.763
-1.003
-17.4%
1 ene 1981 año
5.909
+1.146
24.07%
1 ene 1982 año
10.195
+4.286
72.53%
1 ene 1983 año
9.051
-1.143
-11.22%
1 ene 1984 año
4.335
-4.716
-52.1%
1 ene 1985 año
3.079
-1.257
-28.99%
1 ene 1986 año
2.987
-0.091
-2.96%
1 ene 1987 año
1.564
-1.423
-47.63%
1 ene 1988 año
1.922
+0.358
22.87%
1 ene 1989 año
1.619
-0.303
-15.76%
1 ene 1990 año
2.378
+0.758
46.83%
1 ene 1991 año
2.047
-0.331
-13.91%
1 ene 1992 año
47.109
+45.062
2.2 mil%
1 ene 1993 año
8.73
-38.379
-81.47%
1 ene 1994 año
10.334
+1.604
18.38%
1 ene 1995 año
6.192
-4.142
-40.08%
1 ene 1996 año
7.696
+1.504
24.28%
1 ene 1997 año
5.54
-2.155
-28.01%
1 ene 1998 año
7.963
+2.423
43.73%
1 ene 1999 año
5.762
-2.201
-27.64%
1 ene 2000 año
4.067
-1.695
-29.42%
1 ene 2001 año
5.9
+1.833
45.07%
1 ene 2002 año
6.686
+0.785
13.31%
1 ene 2003 año
3.132
-3.554
-53.16%
1 ene 2004 año
3.786
+0.655
20.9%
1 ene 2005 año
2.356
-1.43
-37.78%
1 ene 2006 año
2.818
+0.463
19.63%
1 ene 2007 año
2.574
-0.244
-8.66%
1 ene 2008 año
5.536
+2.962
115.04%
1 ene 2009 año
5.199
-0.337
-6.09%
1 ene 2010 año
6.247
+1.048
20.15%
1 ene 2011 año
6.88
+0.633
10.14%
1 ene 2012 año
7.375
+0.495
7.2%
1 ene 2013 año
6.397
-0.978
-13.26%
1 ene 2014 año
6.27
-0.128
-1.99%
1 ene 2015 año
6.482
+0.212
3.38%
1 ene 2016 año
6.802
+0.321
4.95%
Ranking de los países por los datos estadísticos actuales


Comentarios: