29
/es/
es
AIzaSyAYiBZKx7MnpbEhh9jyipgxe19OcubqV5w
April 1, 2024
179611
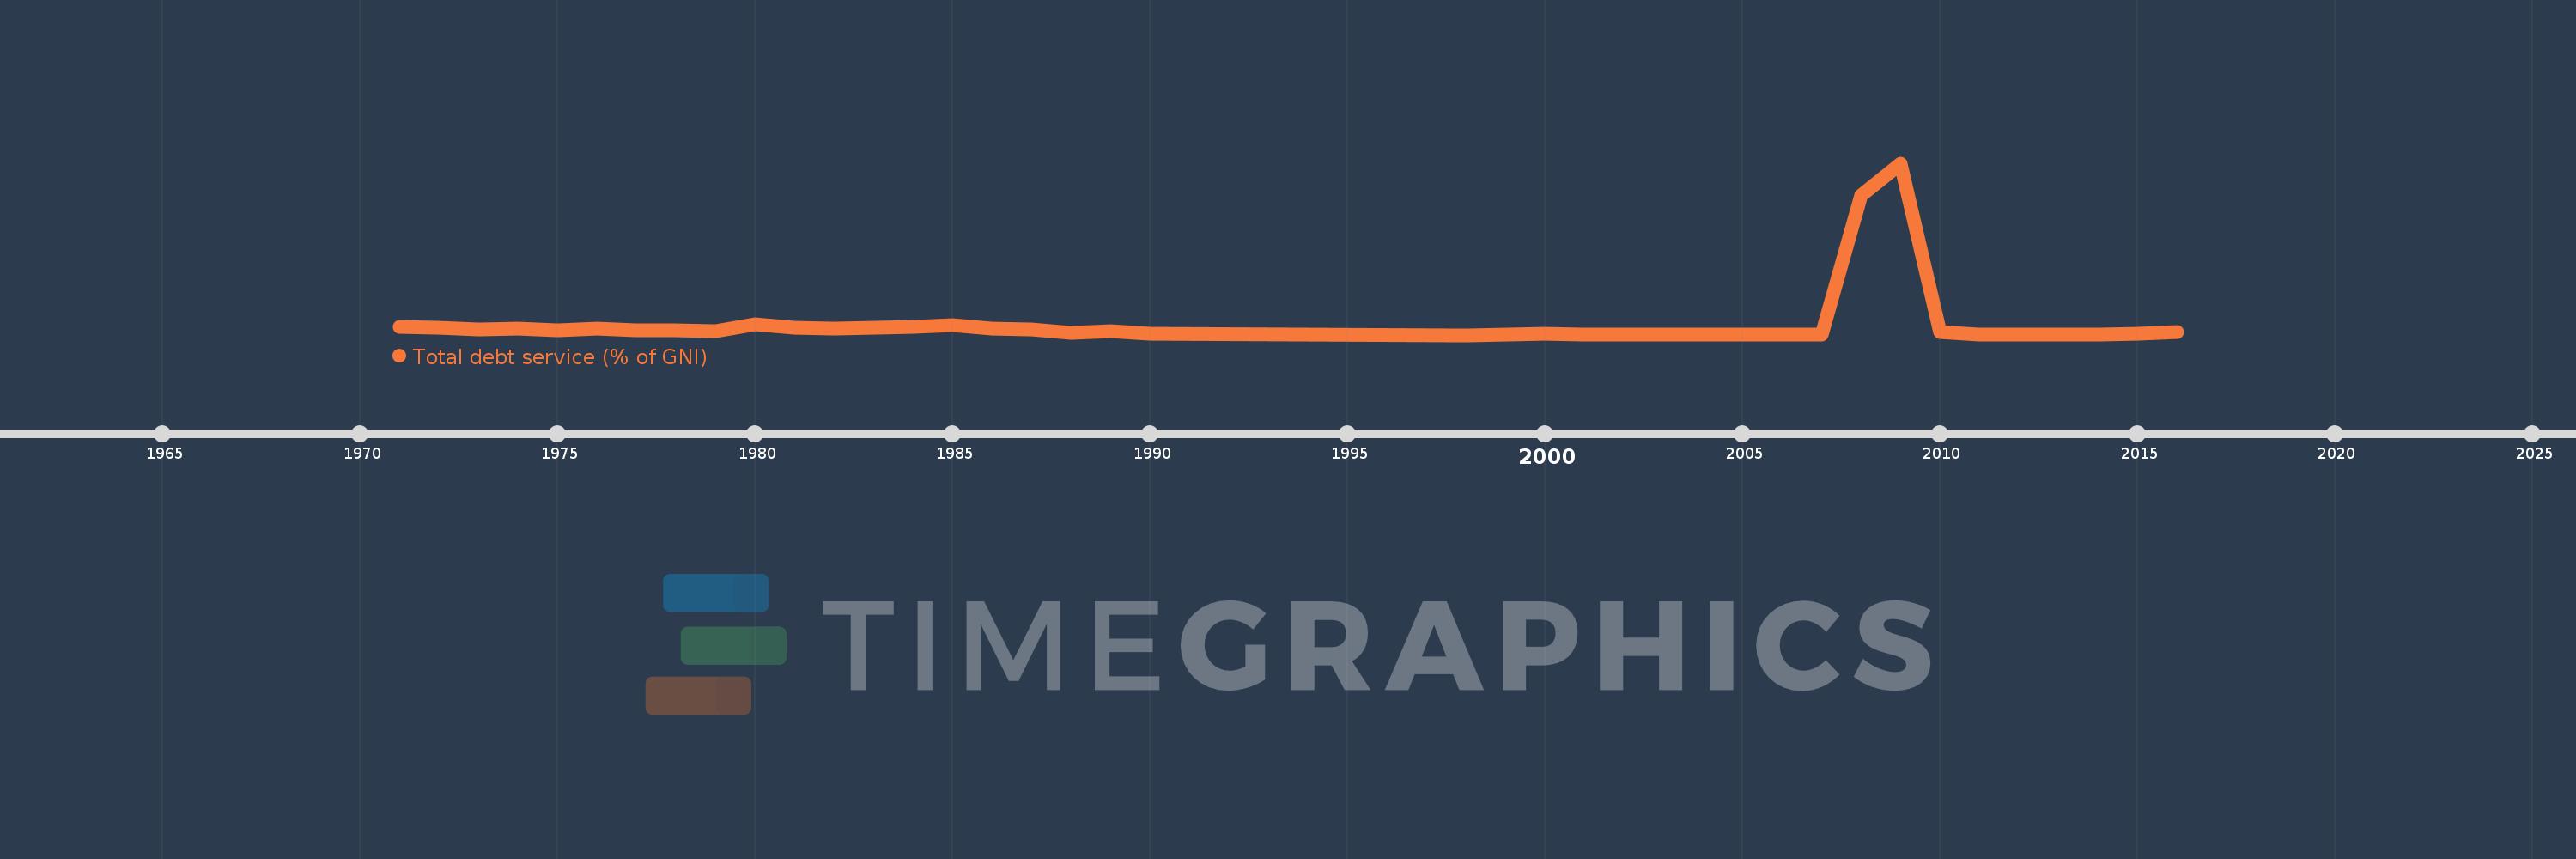
Liberia
LBR
true
2
1
Total debt service (% of GNI)
2016,2015,2014,2013,2012,2011,2010,2009,2008,2007,2006,2005,2004,2003,2002,2001,2000,1999,1998,1990,1989,1988,1987,1986,1985,1984,1983,1982,1981,1980,1979,1978,1977,1976,1975,1974,1973,1972,1971
Estas estadísticas en otros países:
línea de tiempo (timeline):
En esta escala de tiempo se presenta un gráfico de 1971 y 2016 de Liberia. Los datos de 1970 están ausentes. El número de observaciones reales por fecha: 39.
Fuente (nombre):
Indicadores del desarrollo mundial
Fuente (organización):
World Bank, International Debt Statistics.
Categorías:
Economy & Growth, External Debt
Se ha actualizado:
23 abr 2017 año
Los indicadores de los cambios de valor en los últimos años
Mínimo:
0.072
1 ene 1998 año
Máximo:
135.376
1 ene 2009 año
A la fecha de observación
Valor
Cambio absoluto
El cambio con respecto al valor anterior
1 ene 1971 año
6.609
+6.609
0.0%
1 ene 1972 año
5.693
-0.915
-13.85%
1 ene 1973 año
4.775
-0.918
-16.13%
1 ene 1974 año
4.836
+0.061
1.28%
1 ene 1975 año
4.068
-0.768
-15.89%
1 ene 1976 año
5.36
+1.293
31.77%
1 ene 1977 año
3.81
-1.55
-28.93%
1 ene 1978 año
3.555
-0.255
-6.68%
1 ene 1979 año
3.302
-0.253
-7.12%
1 ene 1980 año
8.331
+5.029
152.3%
1 ene 1981 año
5.772
-2.559
-30.72%
1 ene 1982 año
5.091
-0.681
-11.8%
1 ene 1983 año
5.87
+0.779
15.31%
1 ene 1984 año
6.69
+0.82
13.98%
1 ene 1985 año
7.893
+1.202
17.97%
1 ene 1986 año
4.992
-2.9
-36.75%
1 ene 1987 año
4.304
-0.688
-13.78%
1 ene 1988 año
2.048
-2.257
-52.43%
1 ene 1989 año
2.895
+0.848
41.41%
1 ene 1990 año
0.971
-1.924
-66.46%
1 ene 1998 año
0.072
-0.899
-92.63%
1 ene 1999 año
0.32
+0.248
347.2%
1 ene 2000 año
1.109
+0.789
246.48%
1 ene 2001 año
0.434
-0.675
-60.84%
1 ene 2002 año
0.393
-0.042
-9.59%
1 ene 2003 año
0.389
-0.003
-0.85%
1 ene 2004 año
0.252
-0.137
-35.16%
1 ene 2005 año
0.45
+0.198
78.46%
1 ene 2006 año
0.467
+0.017
3.75%
1 ene 2007 año
0.463
-0.004
-0.82%
1 ene 2008 año
109.967
+109.503
23.63 mil%
1 ene 2009 año
135.376
+25.409
23.11%
1 ene 2010 año
2.715
-132.66
-97.99%
1 ene 2011 año
0.552
-2.163
-79.67%
1 ene 2012 año
0.226
-0.326
-59.11%
1 ene 2013 año
0.313
+0.087
38.53%
1 ene 2014 año
0.391
+0.078
24.94%
1 ene 2015 año
1.04
+0.649
166.23%
1 ene 2016 año
2.488
+1.448
139.22%
Ranking de los países por los datos estadísticos actuales


Comentarios: