29
/es/
es
AIzaSyAYiBZKx7MnpbEhh9jyipgxe19OcubqV5w
April 1, 2024
231821
Rwanda
RWA
true
2
1
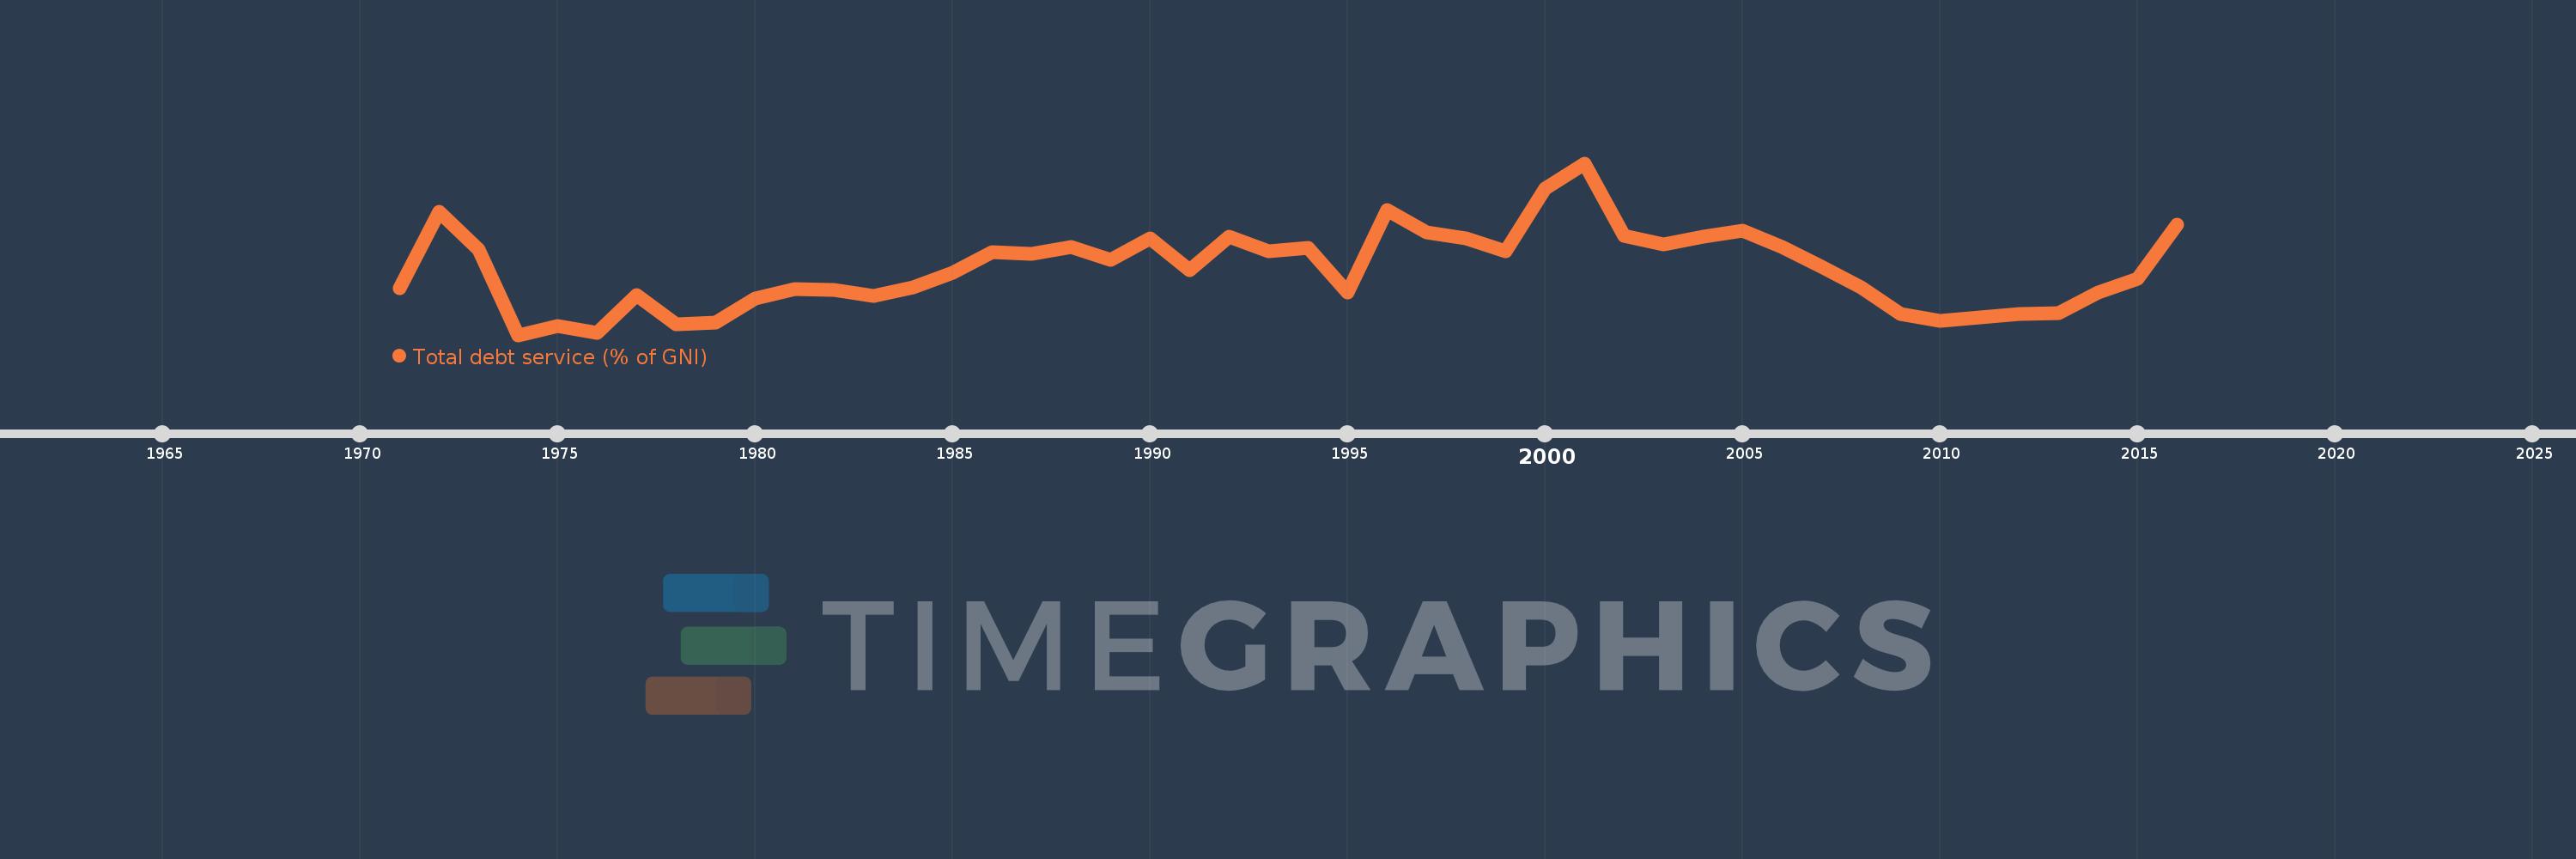
Total debt service (% of GNI)
2016,2015,2014,2013,2012,2011,2010,2009,2008,2007,2006,2005,2004,2003,2002,2001,2000,1999,1998,1997,1996,1995,1994,1993,1992,1991,1990,1989,1988,1987,1986,1985,1984,1983,1982,1981,1980,1979,1978,1977,1976,1975,1974,1973,1972,1971
Estas estadísticas en otros países:
línea de tiempo (timeline):
En esta escala de tiempo se presenta un gráfico de 1971 y 2016 de Rwanda. Los datos de 1970 están ausentes. El número de observaciones reales por fecha: 46.
Fuente (nombre):
Indicadores del desarrollo mundial
Fuente (organización):
World Bank, International Debt Statistics.
Categorías:
Economy & Growth, External Debt
Se ha actualizado:
23 abr 2017 año
Los indicadores de los cambios de valor en los últimos años
Mínimo:
0.049
1 ene 1974 año
Máximo:
2.118
1 ene 2001 año
A la fecha de observación
Valor
Cambio absoluto
El cambio con respecto al valor anterior
1 ene 1971 año
0.611
+0.611
0.0%
1 ene 1972 año
1.534
+0.922
150.83%
1 ene 1973 año
1.075
-0.458
-29.89%
1 ene 1974 año
0.049
-1.026
-95.45%
1 ene 1975 año
0.154
+0.106
215.59%
1 ene 1976 año
0.073
-0.082
-52.85%
1 ene 1977 año
0.528
+0.456
625.68%
1 ene 1978 año
0.178
-0.351
-66.35%
1 ene 1979 año
0.197
+0.019
10.78%
1 ene 1980 año
0.489
+0.292
148.45%
1 ene 1981 año
0.606
+0.116
23.74%
1 ene 1982 año
0.587
-0.019
-3.12%
1 ene 1983 año
0.517
-0.07
-11.86%
1 ene 1984 año
0.626
+0.109
21.13%
1 ene 1985 año
0.795
+0.169
26.96%
1 ene 1986 año
1.049
+0.254
31.88%
1 ene 1987 año
1.03
-0.018
-1.76%
1 ene 1988 año
1.112
+0.082
7.97%
1 ene 1989 año
0.953
-0.16
-14.34%
1 ene 1990 año
1.21
+0.257
26.97%
1 ene 1991 año
0.827
-0.383
-31.62%
1 ene 1992 año
1.229
+0.402
48.6%
1 ene 1993 año
1.053
-0.177
-14.38%
1 ene 1994 año
1.099
+0.047
4.44%
1 ene 1995 año
0.558
-0.542
-49.26%
1 ene 1996 año
1.558
+1.001
179.41%
1 ene 1997 año
1.286
-0.273
-17.49%
1 ene 1998 año
1.211
-0.075
-5.8%
1 ene 1999 año
1.054
-0.157
-12.98%
1 ene 2000 año
1.814
+0.76
72.15%
1 ene 2001 año
2.118
+0.303
16.71%
1 ene 2002 año
1.242
-0.875
-41.33%
1 ene 2003 año
1.144
-0.099
-7.95%
1 ene 2004 año
1.231
+0.088
7.69%
1 ene 2005 año
1.301
+0.069
5.62%
1 ene 2006 año
1.105
-0.195
-15.02%
1 ene 2007 año
0.869
-0.237
-21.42%
1 ene 2008 año
0.628
-0.241
-27.73%
1 ene 2009 año
0.303
-0.324
-51.68%
1 ene 2010 año
0.217
-0.086
-28.31%
1 ene 2011 año
0.257
+0.04
18.38%
1 ene 2012 año
0.302
+0.045
17.45%
1 ene 2013 año
0.315
+0.012
4.07%
1 ene 2014 año
0.562
+0.247
78.47%
1 ene 2015 año
0.731
+0.169
30.11%
1 ene 2016 año
1.377
+0.646
88.4%
Ranking de los países por los datos estadísticos actuales


Comentarios: