30
/es/
AIzaSyAYiBZKx7MnpbEhh9jyipgxe19OcubqV5w
April 1, 2024
65528
Albania
ALB
true
2
1
Total debt service (% of GNI)
2016,2015,2014,2013,2012,2011,2010,2009,2008,2007,2006,2005,2004,2003,2002,2001,2000,1999,1998,1997,1996,1995,1994,1993,1992
Download
Estadísticas Globales de la Biblioteca →Albania →

Total debt service (% of GNI)

Estas estadísticas en otros países:

AfghanistanAlbaniaAlgeriaAngolaArab WorldArgentinaArmeniaAzerbaijanBangladeshBelarusBelizeBeninBhutanBoliviaBosnia and HerzegovinaBotswanaBrazilBulgariaBurkina FasoBurundiCabo VerdeCambodiaCameroonCentral African RepublicCentral Europe and the BalticsChadChinaColombiaComorosCongo, Dem. Rep.Congo, Rep.Costa RicaCote d'IvoireDjiboutiDominicaDominican RepublicEarly-demographic dividendEast Asia & Pacific (excluding high income)East Asia & Pacific (IDA & IBRD countries)EcuadorEgypt, Arab Rep.El SalvadorEritreaEthiopiaEurope & Central Asia (excluding high income)Europe & Central Asia (IDA & IBRD countries)FijiFragile and conflict affected situationsGabonGambia, TheGeorgiaGhanaGrenadaGuatemalaGuineaGuinea-BissauGuyanaHaitiHeavily indebted poor countries (HIPC)HondurasIBRD onlyIDA & IBRD totalIDA blendIDA onlyIDA totalIndiaIndonesiaIran, Islamic Rep.JamaicaJordanKazakhstanKenyaKosovoKyrgyz RepublicLao PDRLate-demographic dividendLatin America & Caribbean Latin America & Caribbean (excluding high income)Latin America & the Caribbean (IDA & IBRD countries)Least developed countries: UN classificationLebanonLesothoLiberiaLow & middle incomeLow incomeLower middle incomeMacedonia, FYRMadagascarMalawiMalaysiaMaldivesMaliMauritaniaMauritiusMexicoMiddle East & North Africa (excluding high income)Middle East & North Africa (IDA & IBRD countries)Middle incomeMoldovaMongoliaMontenegroMoroccoMozambiqueMyanmarNepalNicaraguaNigerNigeriaPacific island small statesPakistanPanamaPapua New GuineaParaguayPeruPhilippinesPre-demographic dividendRomaniaRussian FederationRwandaSamoaSao Tome and PrincipeSenegalSerbiaSierra LeoneSolomon IslandsSomaliaSouth AfricaSouth AsiaSouth Asia (IDA & IBRD)Sri LankaSt. LuciaSt. Vincent and the GrenadinesSub-Saharan Africa Sub-Saharan Africa (excluding high income)Sub-Saharan Africa (IDA & IBRD countries)SudanSwazilandSyrian Arab RepublicTajikistanTanzaniaThailandTogoTongaTunisiaTurkeyTurkmenistanUgandaUkraineUpper middle incomeUzbekistanVanuatuVenezuela, RBVietnamYemen, Rep.ZambiaZimbabwe

línea de tiempo (timeline):

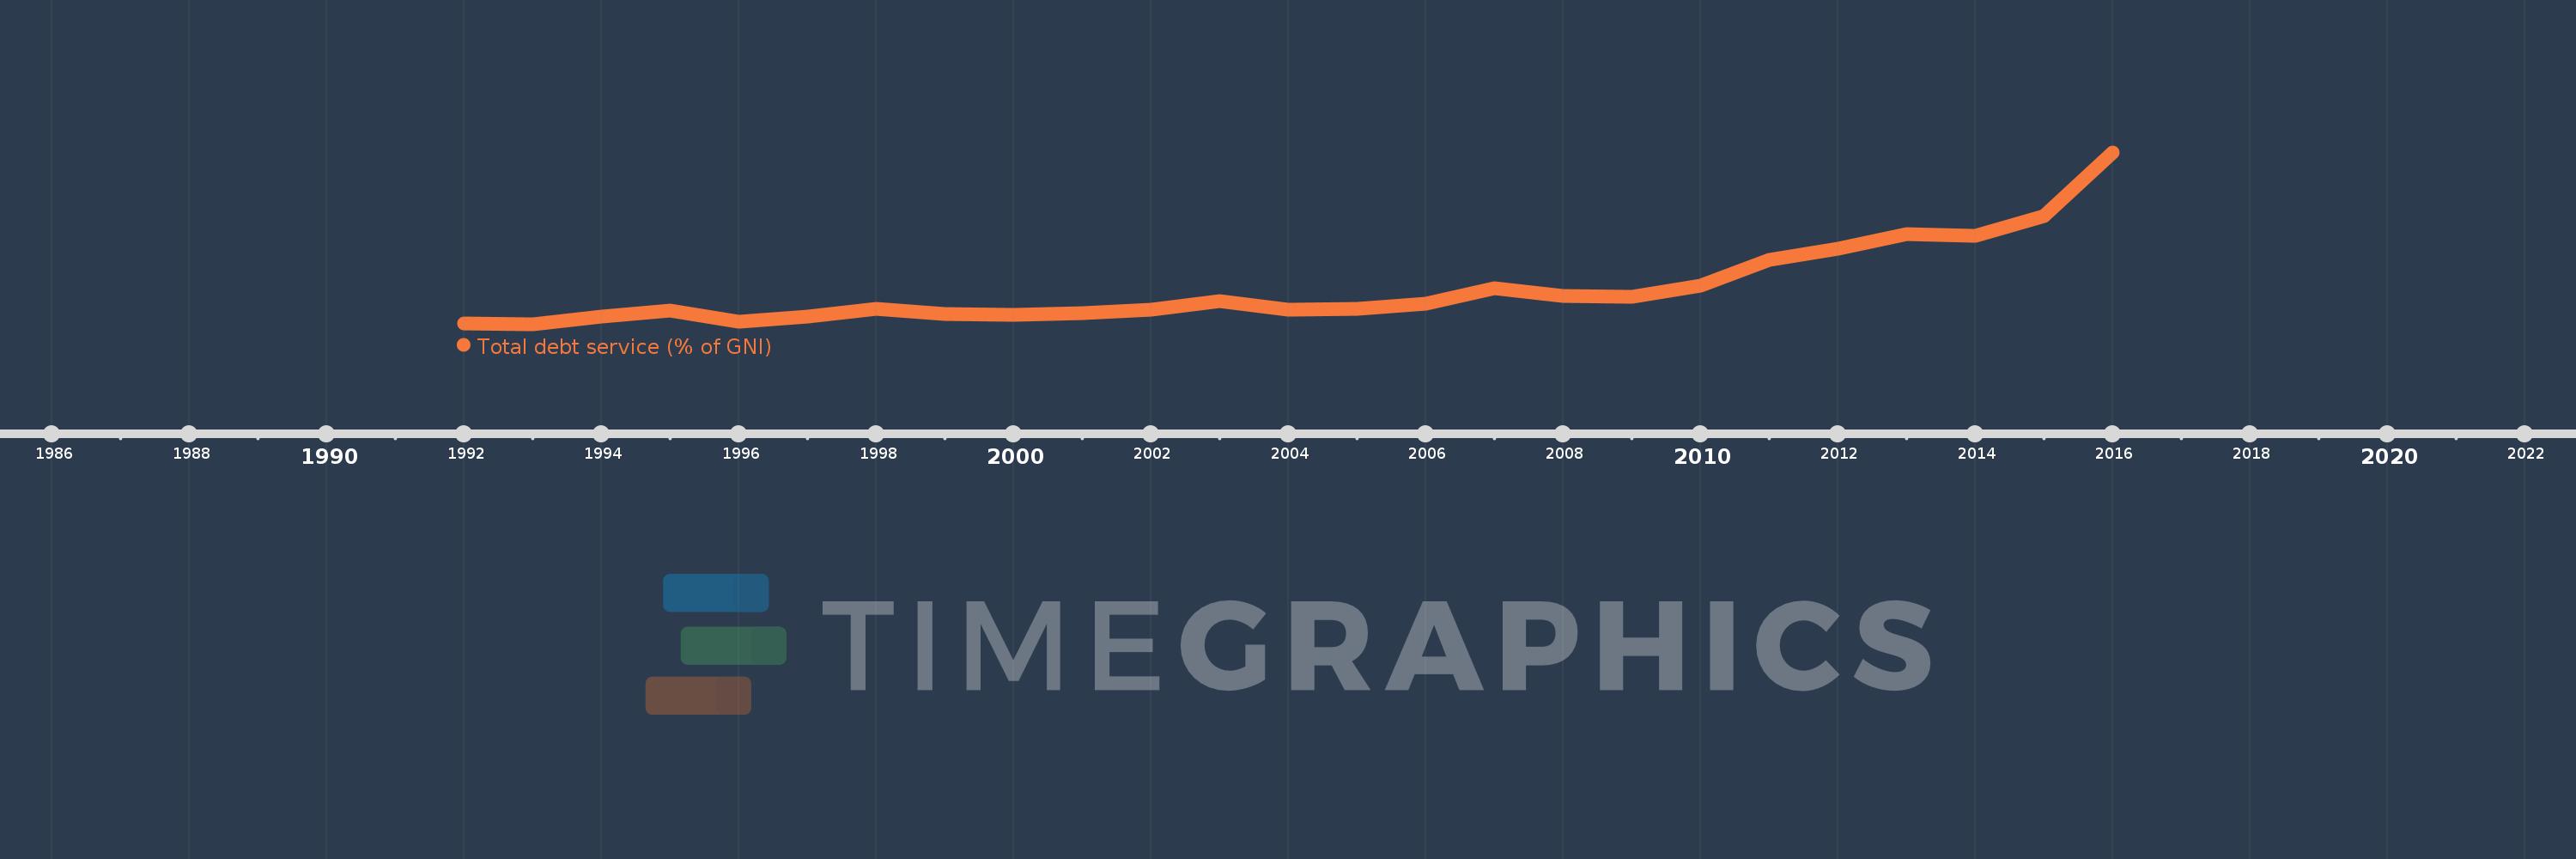
En esta escala de tiempo se presenta un gráfico de 1992 y 2016 de Albania. Los datos de 1991 están ausentes. El número de observaciones reales por fecha: 25.

Fuente (nombre):

Indicadores del desarrollo mundial

Fuente (organización):

World Bank, International Debt Statistics.

Categorías:

Economy & Growth, External Debt

Se ha actualizado:

23 abr 2017 año

Los indicadores de los cambios de valor en los últimos años

En promedio:
1.931
Mínimo:
0.297
1 ene 1993 año
Máximo:
8.125
1 ene 2016 año
A la fecha de observación
Valor
Cambio absoluto
El cambio con respecto al valor anterior
1 ene 1992 año
0.319
+0.319
0.0%
1 ene 1993 año
0.297
-0.022
-7.01%
1 ene 1994 año
0.664
+0.367
123.53%
1 ene 1995 año
0.918
+0.255
38.38%
1 ene 1996 año
0.422
-0.496
-54.04%
1 ene 1997 año
0.628
+0.206
48.87%
1 ene 1998 año
1.002
+0.373
59.41%
1 ene 1999 año
0.77
-0.232
-23.18%
1 ene 2000 año
0.734
-0.036
-4.63%
1 ene 2001 año
0.803
+0.069
9.38%
1 ene 2002 año
0.945
+0.143
17.76%
1 ene 2003 año
1.338
+0.393
41.54%
1 ene 2004 año
0.971
-0.368
-27.48%
1 ene 2005 año
1.016
+0.045
4.65%
1 ene 2006 año
1.252
+0.237
23.3%
1 ene 2007 año
1.946
+0.694
55.41%
1 ene 2008 año
1.585
-0.361
-18.55%
1 ene 2009 año
1.565
-0.02
-1.24%
1 ene 2010 año
2.056
+0.49
31.32%
1 ene 2011 año
3.217
+1.162
56.51%
1 ene 2012 año
3.735
+0.518
16.09%
1 ene 2013 año
4.418
+0.683
18.28%
1 ene 2014 año
4.315
-0.103
-2.34%
1 ene 2015 año
5.223
+0.908
21.04%
1 ene 2016 año
8.125
+2.902
55.57%

Ranking de los países por los datos estadísticos actuales