30
/es/
AIzaSyAYiBZKx7MnpbEhh9jyipgxe19OcubqV5w
April 1, 2024
68488
Angola
AGO
true
2
1
Total debt service (% of GNI)
2016,2015,2014,2013,2012,2011,2010,2009,2008,2007,2006,2005,2004,2003,2002,2001,2000,1999,1998,1997,1996,1995,1991,1990
Download
Estadísticas Globales de la Biblioteca →Angola →

Total debt service (% of GNI)

Estas estadísticas en otros países:

AfghanistanAlbaniaAlgeriaAngolaArab WorldArgentinaArmeniaAzerbaijanBangladeshBelarusBelizeBeninBhutanBoliviaBosnia and HerzegovinaBotswanaBrazilBulgariaBurkina FasoBurundiCabo VerdeCambodiaCameroonCentral African RepublicCentral Europe and the BalticsChadChinaColombiaComorosCongo, Dem. Rep.Congo, Rep.Costa RicaCote d'IvoireDjiboutiDominicaDominican RepublicEarly-demographic dividendEast Asia & Pacific (excluding high income)East Asia & Pacific (IDA & IBRD countries)EcuadorEgypt, Arab Rep.El SalvadorEritreaEthiopiaEurope & Central Asia (excluding high income)Europe & Central Asia (IDA & IBRD countries)FijiFragile and conflict affected situationsGabonGambia, TheGeorgiaGhanaGrenadaGuatemalaGuineaGuinea-BissauGuyanaHaitiHeavily indebted poor countries (HIPC)HondurasIBRD onlyIDA & IBRD totalIDA blendIDA onlyIDA totalIndiaIndonesiaIran, Islamic Rep.JamaicaJordanKazakhstanKenyaKosovoKyrgyz RepublicLao PDRLate-demographic dividendLatin America & Caribbean Latin America & Caribbean (excluding high income)Latin America & the Caribbean (IDA & IBRD countries)Least developed countries: UN classificationLebanonLesothoLiberiaLow & middle incomeLow incomeLower middle incomeMacedonia, FYRMadagascarMalawiMalaysiaMaldivesMaliMauritaniaMauritiusMexicoMiddle East & North Africa (excluding high income)Middle East & North Africa (IDA & IBRD countries)Middle incomeMoldovaMongoliaMontenegroMoroccoMozambiqueMyanmarNepalNicaraguaNigerNigeriaPacific island small statesPakistanPanamaPapua New GuineaParaguayPeruPhilippinesPre-demographic dividendRomaniaRussian FederationRwandaSamoaSao Tome and PrincipeSenegalSerbiaSierra LeoneSolomon IslandsSomaliaSouth AfricaSouth AsiaSouth Asia (IDA & IBRD)Sri LankaSt. LuciaSt. Vincent and the GrenadinesSub-Saharan Africa Sub-Saharan Africa (excluding high income)Sub-Saharan Africa (IDA & IBRD countries)SudanSwazilandSyrian Arab RepublicTajikistanTanzaniaThailandTogoTongaTunisiaTurkeyTurkmenistanUgandaUkraineUpper middle incomeUzbekistanVanuatuVenezuela, RBVietnamYemen, Rep.ZambiaZimbabwe

línea de tiempo (timeline):

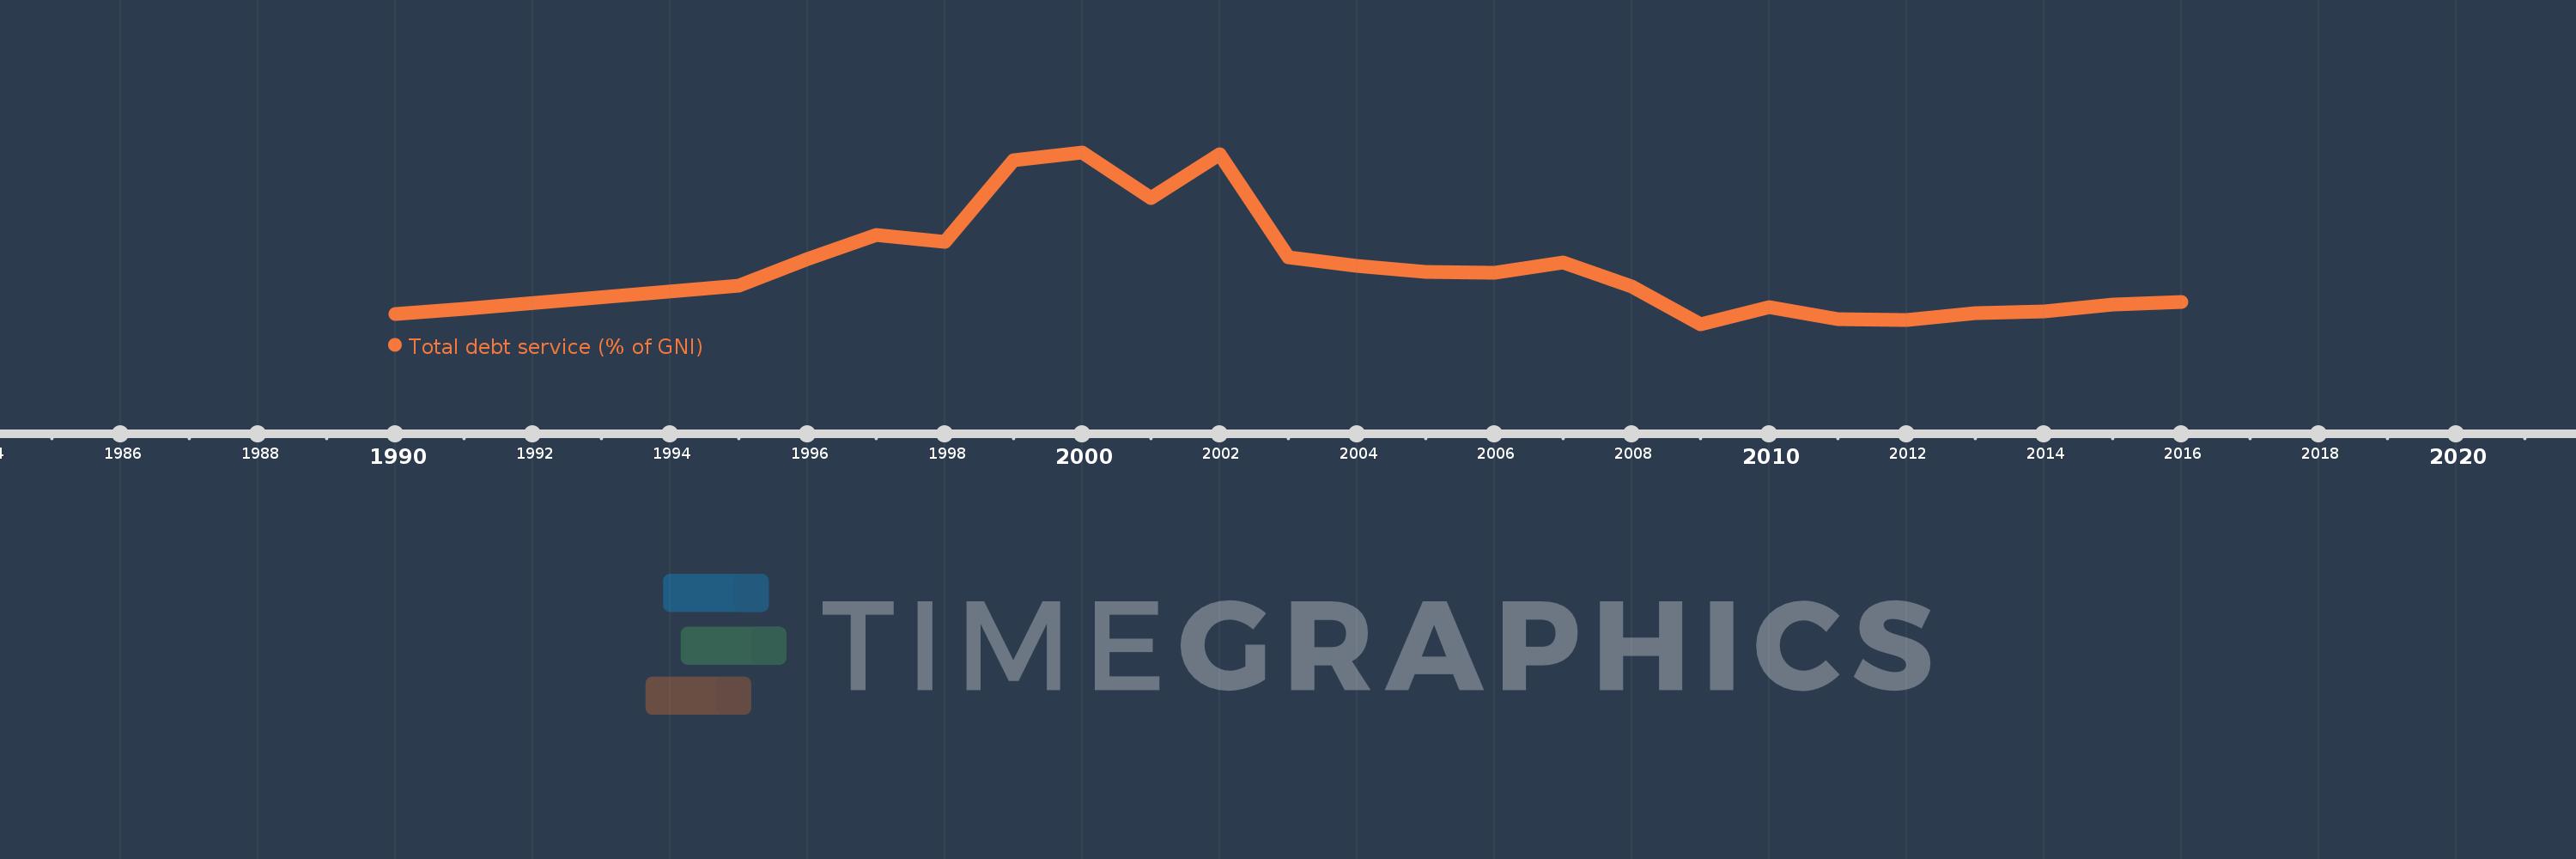
En esta escala de tiempo se presenta un gráfico de 1990 y 2016 de Angola. Los datos de 1989 están ausentes. El número de observaciones reales por fecha: 24.

Fuente (nombre):

Indicadores del desarrollo mundial

Fuente (organización):

World Bank, International Debt Statistics.

Categorías:

Economy & Growth, External Debt

Se ha actualizado:

23 abr 2017 año

Los indicadores de los cambios de valor en los últimos años

En promedio:
11.603
Mínimo:
2.315
1 ene 2009 año
Máximo:
30.589
1 ene 2000 año
A la fecha de observación
Valor
Cambio absoluto
El cambio con respecto al valor anterior
1 ene 1990 año
3.975
+3.975
0.0%
1 ene 1991 año
4.873
+0.898
22.59%
1 ene 1995 año
8.728
+3.855
79.12%
1 ene 1996 año
13.096
+4.369
50.05%
1 ene 1997 año
16.935
+3.839
29.31%
1 ene 1998 año
15.816
-1.12
-6.61%
1 ene 1999 año
29.29
+13.475
85.2%
1 ene 2000 año
30.589
+1.299
4.43%
1 ene 2001 año
23.103
-7.486
-24.47%
1 ene 2002 año
30.36
+7.257
31.41%
1 ene 2003 año
13.349
-17.011
-56.03%
1 ene 2004 año
11.945
-1.405
-10.52%
1 ene 2005 año
10.987
-0.958
-8.02%
1 ene 2006 año
10.802
-0.185
-1.68%
1 ene 2007 año
12.436
+1.634
15.12%
1 ene 2008 año
8.496
-3.94
-31.68%
1 ene 2009 año
2.315
-6.181
-72.75%
1 ene 2010 año
5.176
+2.862
123.61%
1 ene 2011 año
3.106
-2.071
-40.0%
1 ene 2012 año
3.019
-0.087
-2.79%
1 ene 2013 año
4.093
+1.074
35.56%
1 ene 2014 año
4.374
+0.281
6.87%
1 ene 2015 año
5.622
+1.248
28.52%
1 ene 2016 año
5.998
+0.376
6.69%

Ranking de los países por los datos estadísticos actuales