29
/es/
es
AIzaSyAYiBZKx7MnpbEhh9jyipgxe19OcubqV5w
April 1, 2024
99376
Cambodia
KHM
true
2
1
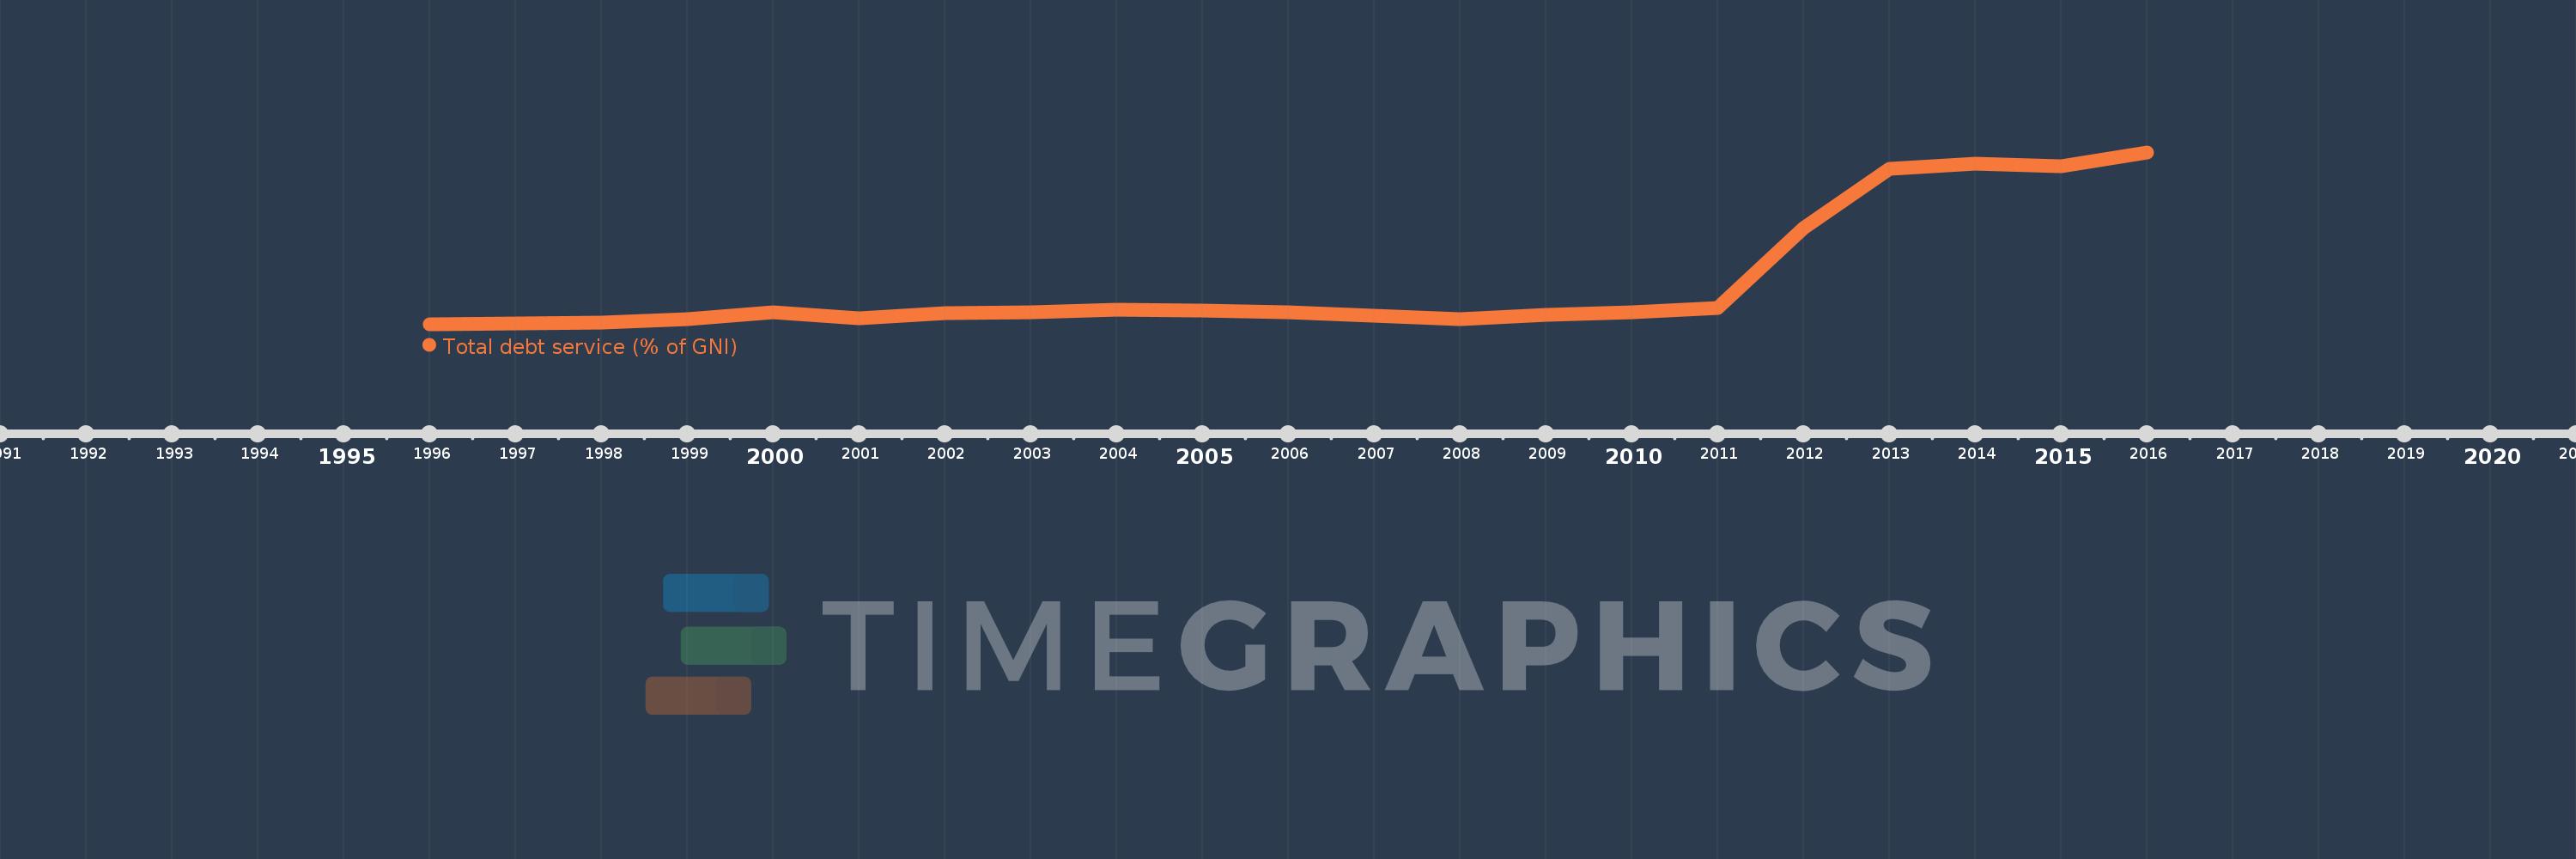
Total debt service (% of GNI)
2016,2015,2014,2013,2012,2011,2010,2009,2008,2007,2006,2005,2004,2003,2002,2001,2000,1999,1998,1997,1996
Estas estadísticas en otros países:
línea de tiempo (timeline):
En esta escala de tiempo se presenta un gráfico de 1996 y 2016 de Cambodia. Los datos de 1995 están ausentes. El número de observaciones reales por fecha: 21.
Fuente (nombre):
Indicadores del desarrollo mundial
Fuente (organización):
World Bank, International Debt Statistics.
Categorías:
Economy & Growth, External Debt
Se ha actualizado:
23 abr 2017 año
Los indicadores de los cambios de valor en los últimos años
Mínimo:
0.195
1 ene 1996 año
Máximo:
4.535
1 ene 2016 año
A la fecha de observación
Valor
Cambio absoluto
El cambio con respecto al valor anterior
1 ene 1996 año
0.195
+0.195
0.0%
1 ene 1997 año
0.218
+0.023
11.9%
1 ene 1998 año
0.234
+0.016
7.37%
1 ene 1999 año
0.317
+0.083
35.33%
1 ene 2000 año
0.49
+0.173
54.59%
1 ene 2001 año
0.355
-0.135
-27.54%
1 ene 2002 año
0.481
+0.126
35.51%
1 ene 2003 año
0.499
+0.018
3.74%
1 ene 2004 año
0.566
+0.067
13.53%
1 ene 2005 año
0.536
-0.03
-5.25%
1 ene 2006 año
0.495
-0.042
-7.8%
1 ene 2007 año
0.42
-0.074
-15.01%
1 ene 2008 año
0.329
-0.091
-21.66%
1 ene 2009 año
0.421
+0.091
27.74%
1 ene 2010 año
0.497
+0.077
18.2%
1 ene 2011 año
0.609
+0.112
22.54%
1 ene 2012 año
2.628
+2.019
331.48%
1 ene 2013 año
4.111
+1.482
56.39%
1 ene 2014 año
4.241
+0.13
3.17%
1 ene 2015 año
4.18
-0.061
-1.43%
1 ene 2016 año
4.535
+0.355
8.49%
Ranking de los países por los datos estadísticos actuales


Comentarios: