30
/es/
AIzaSyAYiBZKx7MnpbEhh9jyipgxe19OcubqV5w
April 1, 2024
261707
Tanzania
TZA
true
2
1
Total debt service (% of GNI)
2016,2015,2014,2013,2012,2011,2010,2009,2008,2007,2006,2005,2004,2003,2002,2001,2000,1999,1998,1997,1996,1995,1994,1993,1992,1991,1990,1989
Download
Estadísticas Globales de la Biblioteca →Tanzania →

Total debt service (% of GNI)

Estas estadísticas en otros países:

AfghanistanAlbaniaAlgeriaAngolaArab WorldArgentinaArmeniaAzerbaijanBangladeshBelarusBelizeBeninBhutanBoliviaBosnia and HerzegovinaBotswanaBrazilBulgariaBurkina FasoBurundiCabo VerdeCambodiaCameroonCentral African RepublicCentral Europe and the BalticsChadChinaColombiaComorosCongo, Dem. Rep.Congo, Rep.Costa RicaCote d'IvoireDjiboutiDominicaDominican RepublicEarly-demographic dividendEast Asia & Pacific (excluding high income)East Asia & Pacific (IDA & IBRD countries)EcuadorEgypt, Arab Rep.El SalvadorEritreaEthiopiaEurope & Central Asia (excluding high income)Europe & Central Asia (IDA & IBRD countries)FijiFragile and conflict affected situationsGabonGambia, TheGeorgiaGhanaGrenadaGuatemalaGuineaGuinea-BissauGuyanaHaitiHeavily indebted poor countries (HIPC)HondurasIBRD onlyIDA & IBRD totalIDA blendIDA onlyIDA totalIndiaIndonesiaIran, Islamic Rep.JamaicaJordanKazakhstanKenyaKosovoKyrgyz RepublicLao PDRLate-demographic dividendLatin America & Caribbean Latin America & Caribbean (excluding high income)Latin America & the Caribbean (IDA & IBRD countries)Least developed countries: UN classificationLebanonLesothoLiberiaLow & middle incomeLow incomeLower middle incomeMacedonia, FYRMadagascarMalawiMalaysiaMaldivesMaliMauritaniaMauritiusMexicoMiddle East & North Africa (excluding high income)Middle East & North Africa (IDA & IBRD countries)Middle incomeMoldovaMongoliaMontenegroMoroccoMozambiqueMyanmarNepalNicaraguaNigerNigeriaPacific island small statesPakistanPanamaPapua New GuineaParaguayPeruPhilippinesPre-demographic dividendRomaniaRussian FederationRwandaSamoaSao Tome and PrincipeSenegalSerbiaSierra LeoneSolomon IslandsSomaliaSouth AfricaSouth AsiaSouth Asia (IDA & IBRD)Sri LankaSt. LuciaSt. Vincent and the GrenadinesSub-Saharan Africa Sub-Saharan Africa (excluding high income)Sub-Saharan Africa (IDA & IBRD countries)SudanSwazilandSyrian Arab RepublicTajikistanTanzaniaThailandTogoTongaTunisiaTurkeyTurkmenistanUgandaUkraineUpper middle incomeUzbekistanVanuatuVenezuela, RBVietnamYemen, Rep.ZambiaZimbabwe

línea de tiempo (timeline):

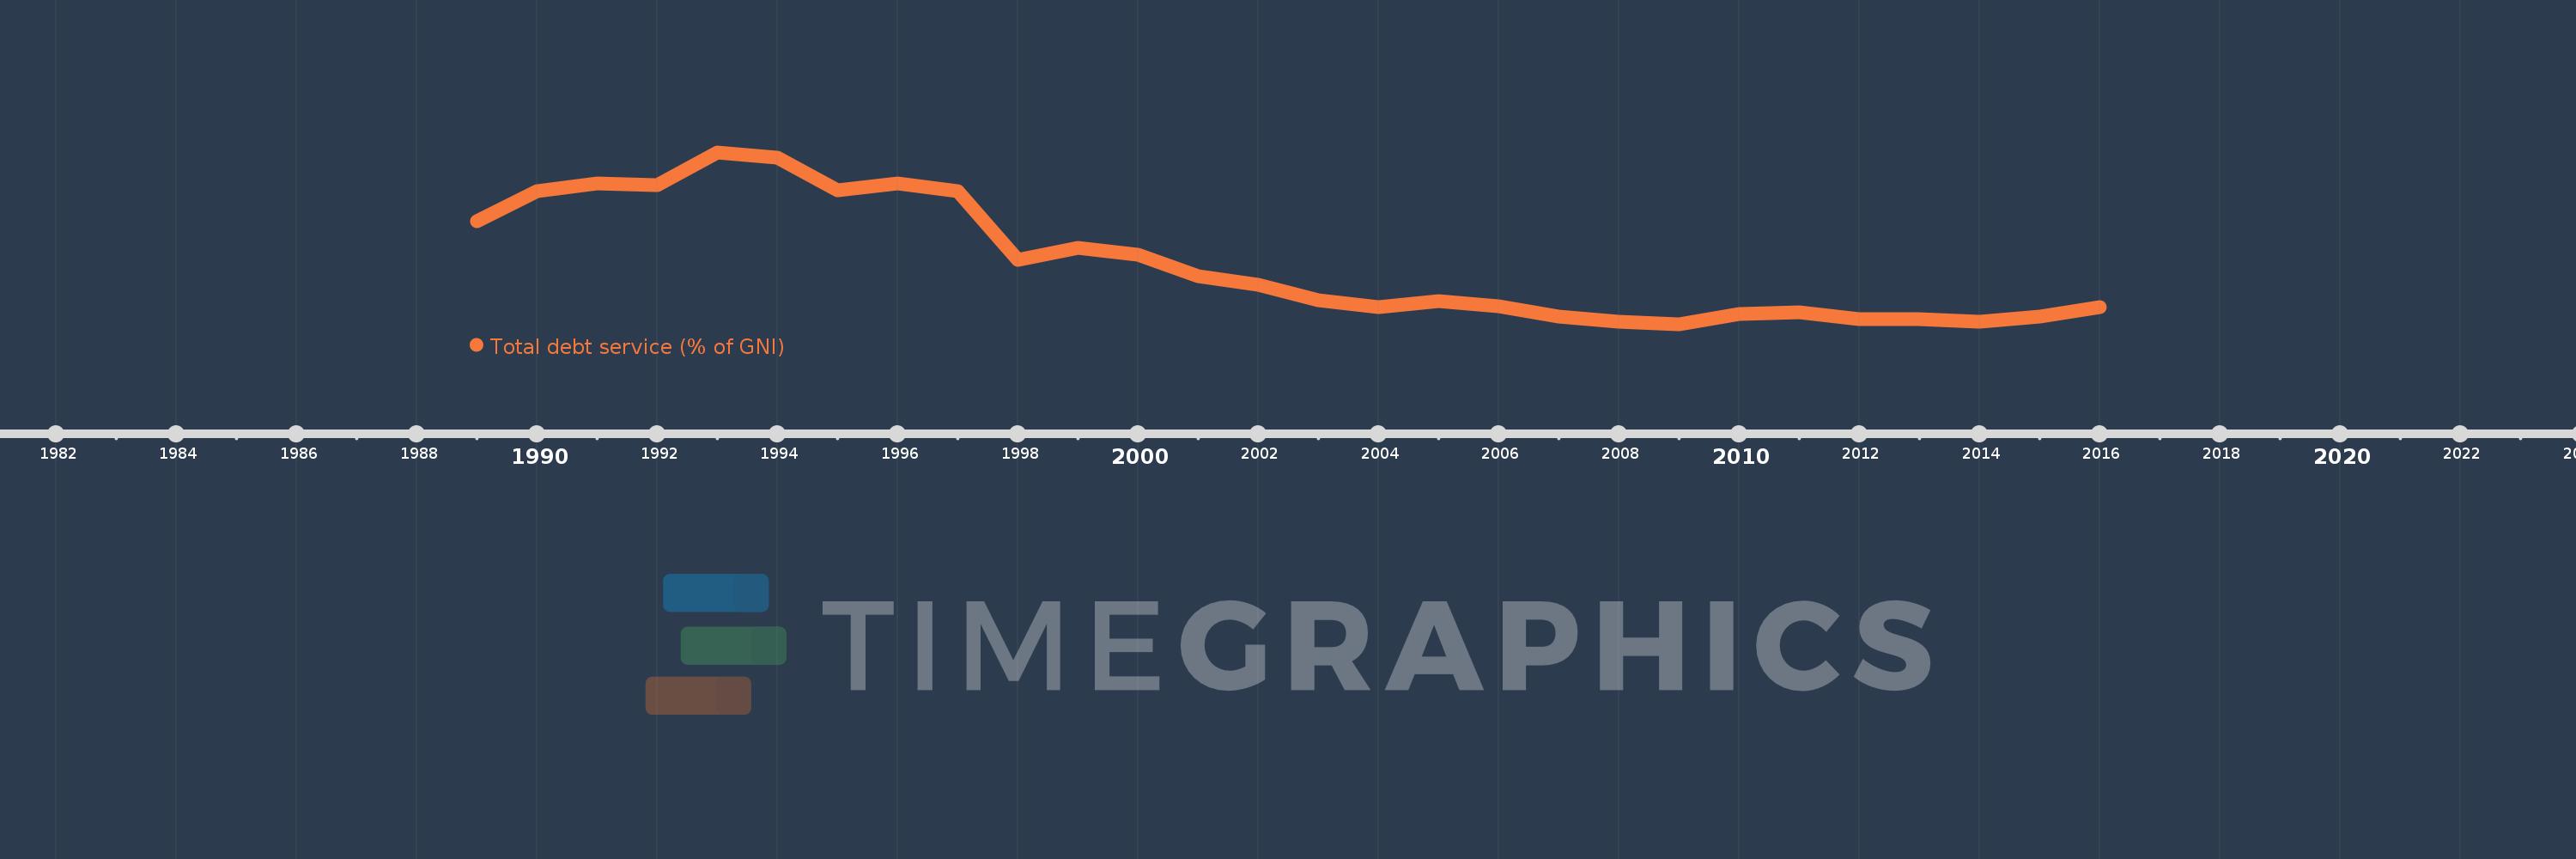
En esta escala de tiempo se presenta un gráfico de 1989 y 2016 de Tanzania. Los datos de 1988 están ausentes. El número de observaciones reales por fecha: 28.

Fuente (nombre):

Indicadores del desarrollo mundial

Fuente (organización):

World Bank, International Debt Statistics.

Categorías:

Economy & Growth, External Debt

Se ha actualizado:

23 abr 2017 año

Los indicadores de los cambios de valor en los últimos años

En promedio:
2.064
Mínimo:
0.268
1 ene 2009 año
Máximo:
5.312
1 ene 1993 año
A la fecha de observación
Valor
Cambio absoluto
El cambio con respecto al valor anterior
1 ene 1989 año
3.29
+3.29
0.0%
1 ene 1990 año
4.178
+0.888
27.0%
1 ene 1991 año
4.396
+0.218
5.22%
1 ene 1992 año
4.351
-0.046
-1.04%
1 ene 1993 año
5.312
+0.962
22.11%
1 ene 1994 año
5.153
-0.159
-3.0%
1 ene 1995 año
4.211
-0.942
-18.28%
1 ene 1996 año
4.411
+0.2
4.74%
1 ene 1997 año
4.174
-0.237
-5.37%
1 ene 1998 año
2.159
-2.015
-48.28%
1 ene 1999 año
2.518
+0.36
16.66%
1 ene 2000 año
2.318
-0.2
-7.95%
1 ene 2001 año
1.675
-0.644
-27.76%
1 ene 2002 año
1.417
-0.258
-15.4%
1 ene 2003 año
0.978
-0.439
-30.96%
1 ene 2004 año
0.771
-0.207
-21.15%
1 ene 2005 año
0.957
+0.186
24.1%
1 ene 2006 año
0.804
-0.154
-16.04%
1 ene 2007 año
0.48
-0.323
-40.25%
1 ene 2008 año
0.342
-0.138
-28.7%
1 ene 2009 año
0.268
-0.074
-21.66%
1 ene 2010 año
0.577
+0.309
115.12%
1 ene 2011 año
0.612
+0.036
6.16%
1 ene 2012 año
0.422
-0.19
-31.1%
1 ene 2013 año
0.411
-0.011
-2.58%
1 ene 2014 año
0.351
-0.06
-14.5%
1 ene 2015 año
0.501
+0.149
42.41%
1 ene 2016 año
0.763
+0.263
52.45%

Ranking de los países por los datos estadísticos actuales