29
/es/
es
AIzaSyAYiBZKx7MnpbEhh9jyipgxe19OcubqV5w
April 1, 2024
152187
Hungary
HUN
true
2
1
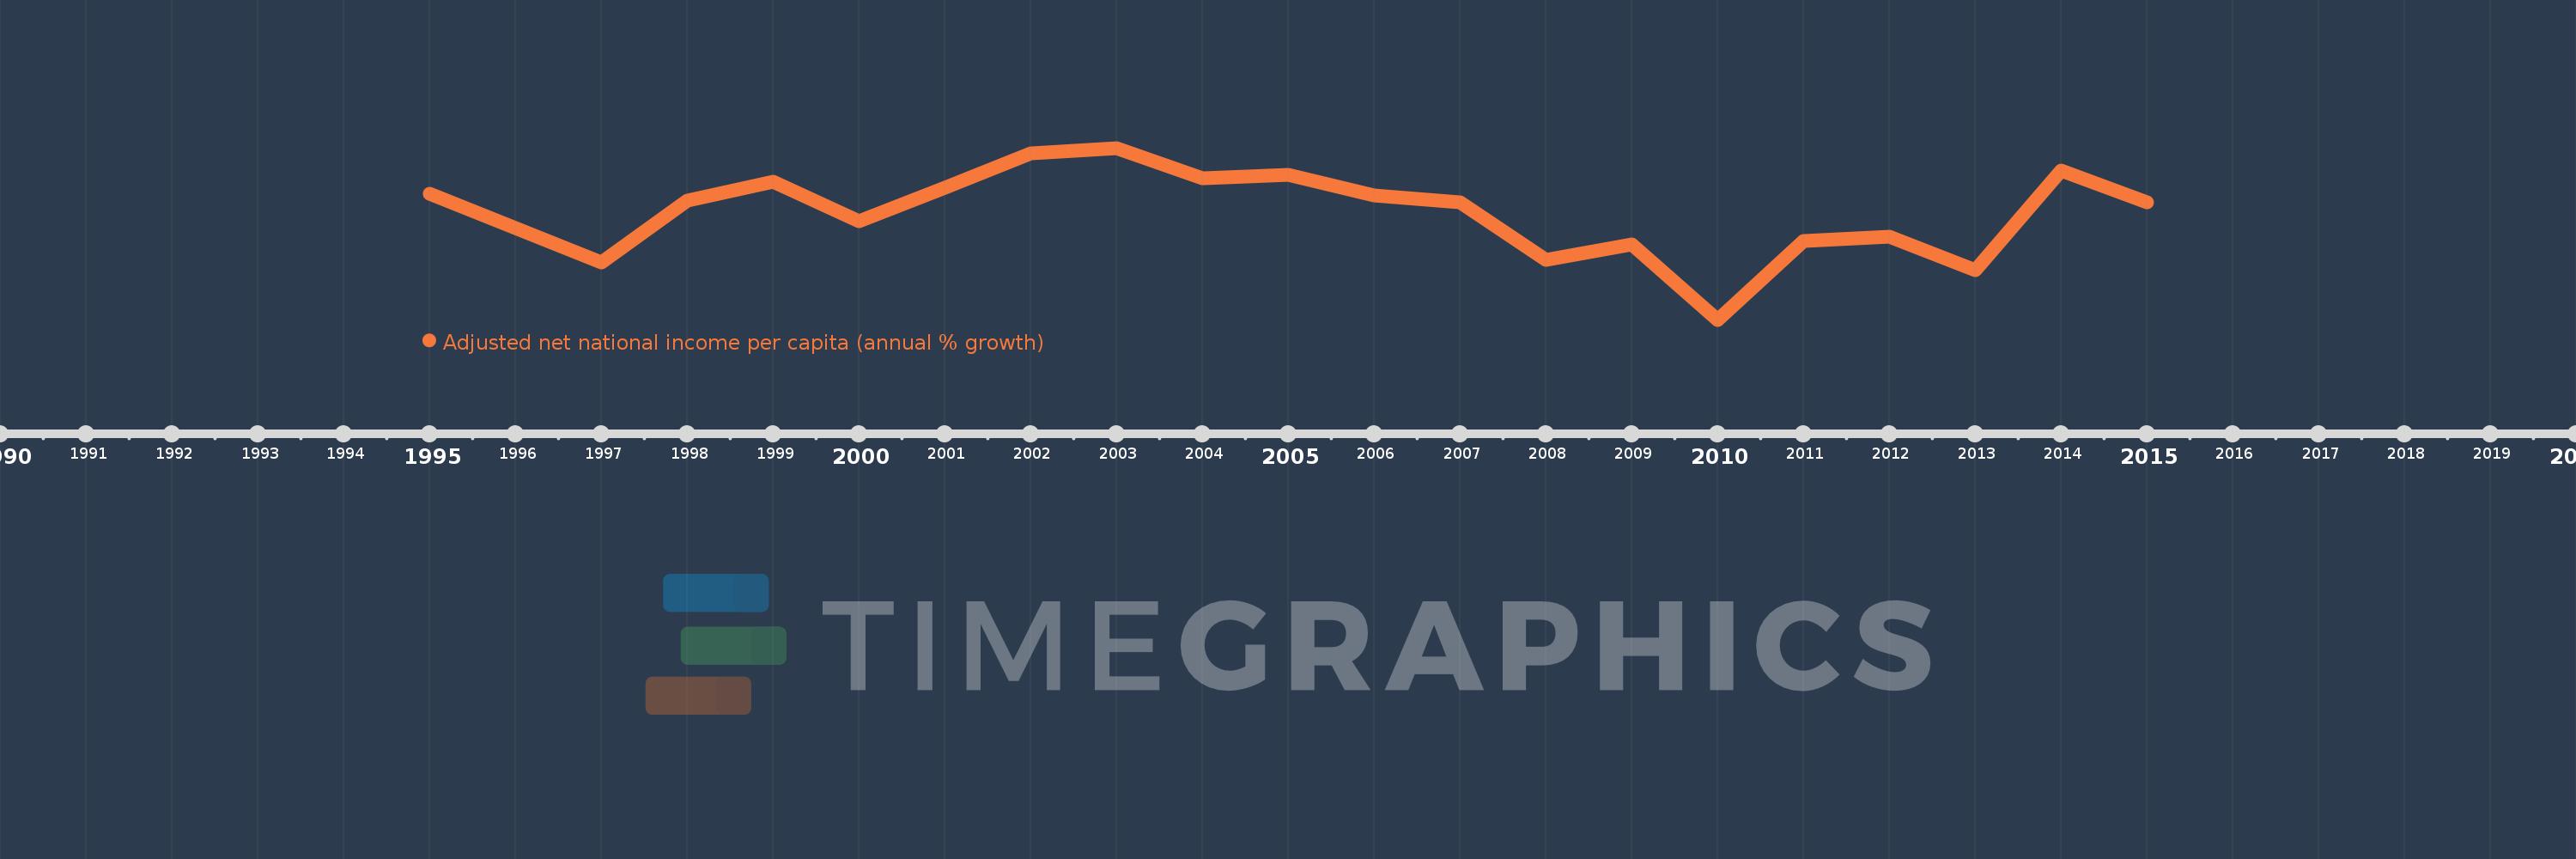
Adjusted net national income per capita (annual % growth)
2015,2014,2013,2012,2011,2010,2009,2008,2007,2006,2005,2004,2003,2002,2001,2000,1999,1998,1997,1996,1995
Estas estadísticas en otros países:
línea de tiempo (timeline):
En esta escala de tiempo se presenta un gráfico de 1995 y 2015 de Hungary. Los datos de 1994 están ausentes. El número de observaciones reales por fecha: 21.
Fuente (nombre):
Indicadores del desarrollo mundial
Fuente (organización):
World Bank staff estimates based on sources and methods in World Bank's "The Changing Wealth of Nations: Measuring Sustainable Development in the New Millennium" (2011).
Categorías:
Economy & Growth
Se ha actualizado:
23 abr 2017 año
Los indicadores de los cambios de valor en los últimos años
Mínimo:
-5.219
1 ene 2010 año
Máximo:
7.144
1 ene 2003 año
A la fecha de observación
Valor
Cambio absoluto
El cambio con respecto al valor anterior
1 ene 1995 año
3.826
+3.826
0.0%
1 ene 1996 año
1.35
-2.476
-64.71%
1 ene 1997 año
-1.087
-2.437
-180.53%
1 ene 1998 año
3.385
+4.472
-411.32%
1 ene 1999 año
4.716
+1.331
39.34%
1 ene 2000 año
1.86
-2.856
-60.56%
1 ene 2001 año
4.285
+2.426
130.43%
1 ene 2002 año
6.727
+2.442
56.97%
1 ene 2003 año
7.144
+0.417
6.19%
1 ene 2004 año
4.98
-2.163
-30.28%
1 ene 2005 año
5.238
+0.258
5.17%
1 ene 2006 año
3.716
-1.522
-29.06%
1 ene 2007 año
3.233
-0.483
-12.99%
1 ene 2008 año
-0.919
-4.152
-128.41%
1 ene 2009 año
0.232
+1.151
-125.3%
1 ene 2010 año
-5.219
-5.452
-2.35 mil%
1 ene 2011 año
0.464
+5.684
-108.9%
1 ene 2012 año
0.763
+0.299
64.37%
1 ene 2013 año
-1.652
-2.416
-316.49%
1 ene 2014 año
5.521
+7.173
-434.11%
1 ene 2015 año
3.202
-2.319
-42.0%
Ranking de los países por los datos estadísticos actuales


Comentarios: