29
/es/
es
AIzaSyAYiBZKx7MnpbEhh9jyipgxe19OcubqV5w
April 1, 2024
57827
South Asia (IDA & IBRD)
TSA
false
2
1
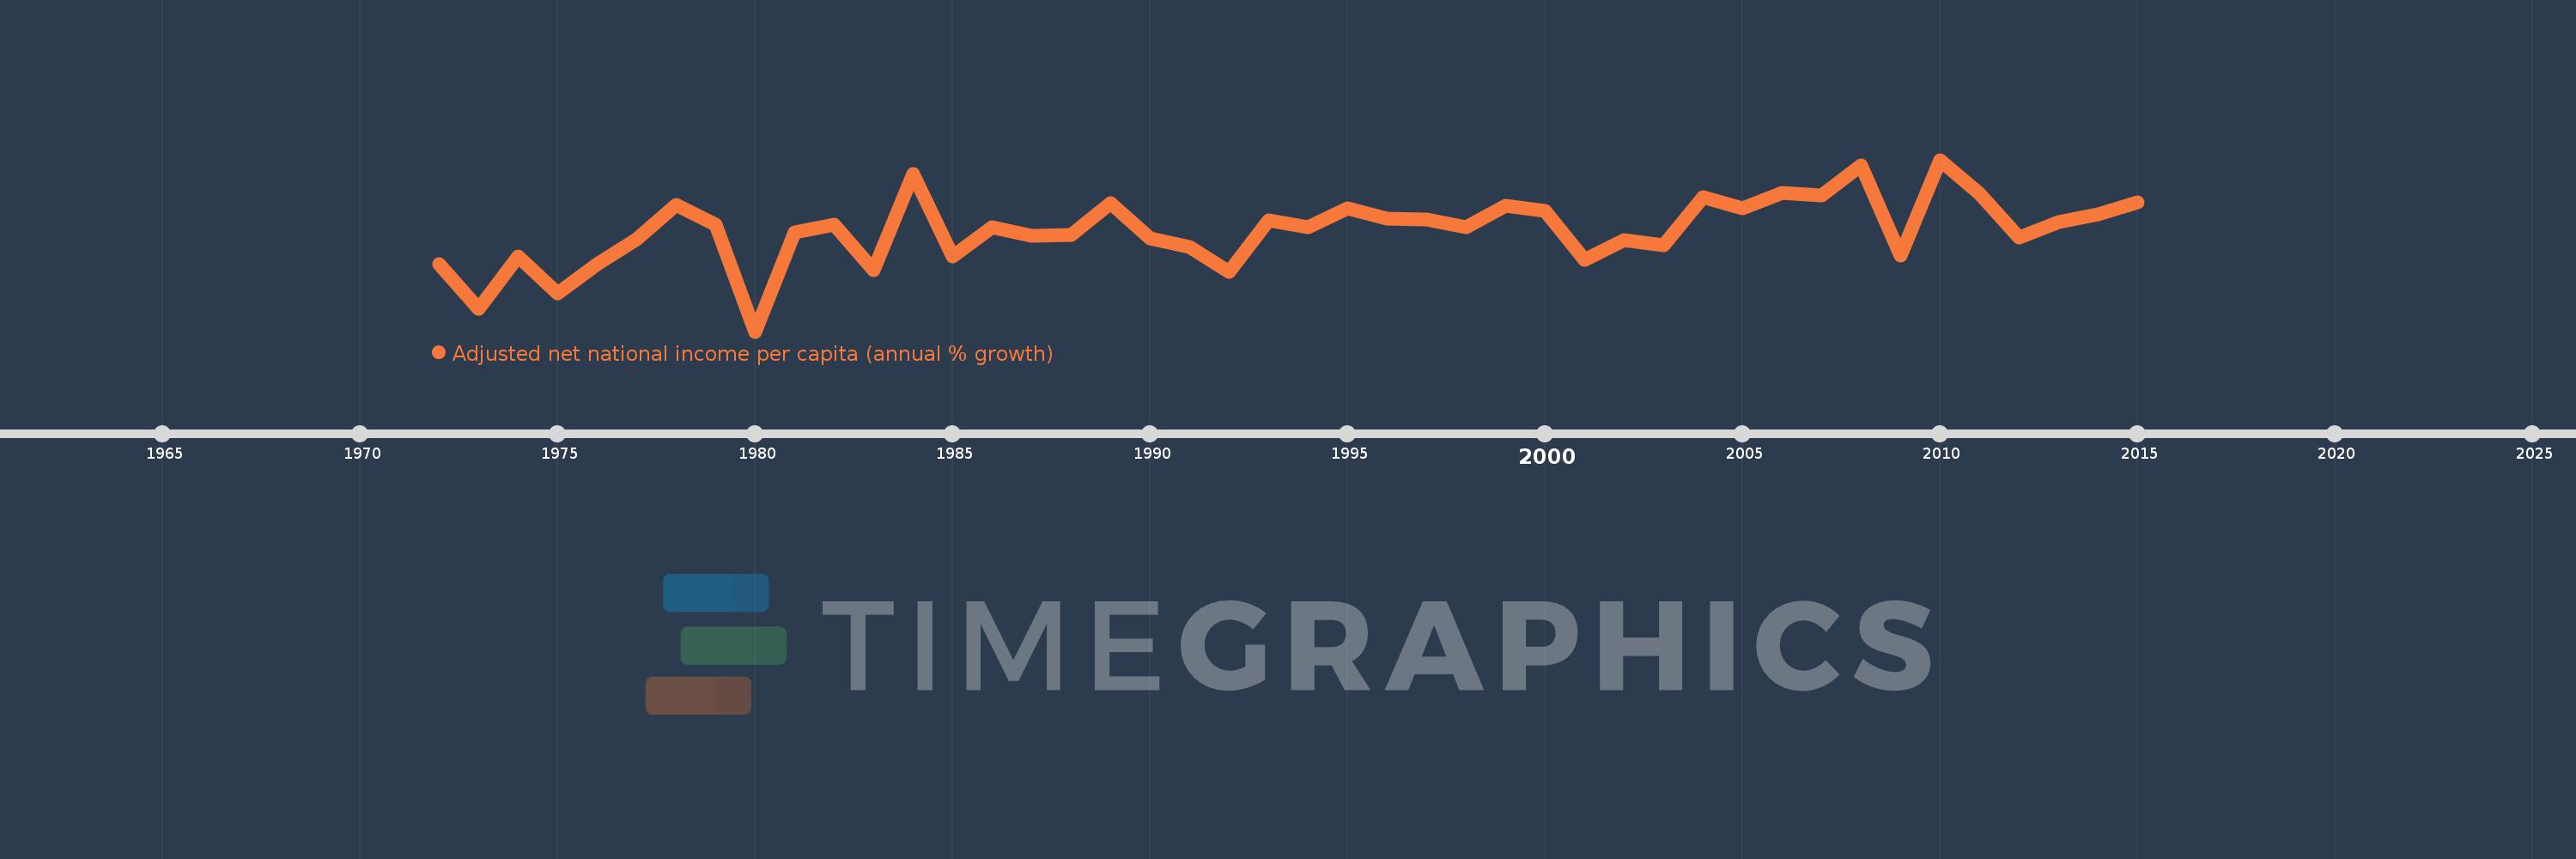
Adjusted net national income per capita (annual % growth)
2015,2014,2013,2012,2011,2010,2009,2008,2007,2006,2005,2004,2003,2002,2001,2000,1999,1998,1997,1996,1995,1994,1993,1992,1991,1990,1989,1988,1987,1986,1985,1984,1983,1982,1981,1980,1979,1978,1977,1976,1975,1974,1973,1972
Estas estadísticas en otros países:
línea de tiempo (timeline):
En esta escala de tiempo se presenta un gráfico de 1972 y 2015 de South Asia (IDA & IBRD). Los datos de 1971 están ausentes. El número de observaciones reales por fecha: 44.
Fuente (nombre):
Indicadores del desarrollo mundial
Fuente (organización):
World Bank staff estimates based on sources and methods in World Bank's "The Changing Wealth of Nations: Measuring Sustainable Development in the New Millennium" (2011).
Categorías:
Economy & Growth
Se ha actualizado:
23 abr 2017 año
Los indicadores de los cambios de valor en los últimos años
Mínimo:
-6.092
1 ene 1980 año
Máximo:
9.371
1 ene 2010 año
A la fecha de observación
Valor
Cambio absoluto
El cambio con respecto al valor anterior
1 ene 1972 año
0.011
+0.011
0.0%
1 ene 1973 año
-4.078
-4.089
-38.28 mil%
1 ene 1974 año
0.672
+4.75
-116.49%
1 ene 1975 año
-2.668
-3.34
-496.91%
1 ene 1976 año
0.014
+2.683
-100.54%
1 ene 1977 año
2.217
+2.203
15.22 mil%
1 ene 1978 año
5.34
+3.123
140.87%
1 ene 1979 año
3.568
-1.772
-33.18%
1 ene 1980 año
-6.092
-9.66
-270.71%
1 ene 1981 año
2.818
+8.909
-146.26%
1 ene 1982 año
3.545
+0.727
25.8%
1 ene 1983 año
-0.596
-4.141
-116.8%
1 ene 1984 año
8.097
+8.693
-1.46 mil%
1 ene 1985 año
0.657
-7.44
-91.88%
1 ene 1986 año
3.33
+2.673
406.62%
1 ene 1987 año
2.52
-0.81
-24.33%
1 ene 1988 año
2.61
+0.09
3.57%
1 ene 1989 año
5.501
+2.891
110.76%
1 ene 1990 año
2.319
-3.181
-57.83%
1 ene 1991 año
1.486
-0.833
-35.94%
1 ene 1992 año
-0.732
-2.218
-149.29%
1 ene 1993 año
3.956
+4.688
-640.13%
1 ene 1994 año
3.305
-0.651
-16.45%
1 ene 1995 año
4.97
+1.665
50.38%
1 ene 1996 año
4.062
-0.908
-18.27%
1 ene 1997 año
3.976
-0.086
-2.11%
1 ene 1998 año
3.322
-0.655
-16.47%
1 ene 1999 año
5.254
+1.933
58.18%
1 ene 2000 año
4.737
-0.517
-9.85%
1 ene 2001 año
0.338
-4.398
-92.85%
1 ene 2002 año
2.167
+1.828
540.1%
1 ene 2003 año
1.66
-0.507
-23.39%
1 ene 2004 año
6.005
+4.345
261.78%
1 ene 2005 año
5.001
-1.004
-16.72%
1 ene 2006 año
6.433
+1.432
28.64%
1 ene 2007 año
6.136
-0.297
-4.61%
1 ene 2008 año
8.898
+2.762
45.02%
1 ene 2009 año
0.776
-8.122
-91.28%
1 ene 2010 año
9.371
+8.595
1.11 mil%
1 ene 2011 año
6.282
-3.089
-32.97%
1 ene 2012 año
2.364
-3.918
-62.37%
1 ene 2013 año
3.76
+1.396
59.07%
1 ene 2014 año
4.494
+0.734
19.53%
1 ene 2015 año
5.557
+1.063
23.64%
Ranking de los países por los datos estadísticos actuales


Comentarios: