29
/es/
es
AIzaSyAYiBZKx7MnpbEhh9jyipgxe19OcubqV5w
April 1, 2024
79147
Barbados
BRB
true
2
1
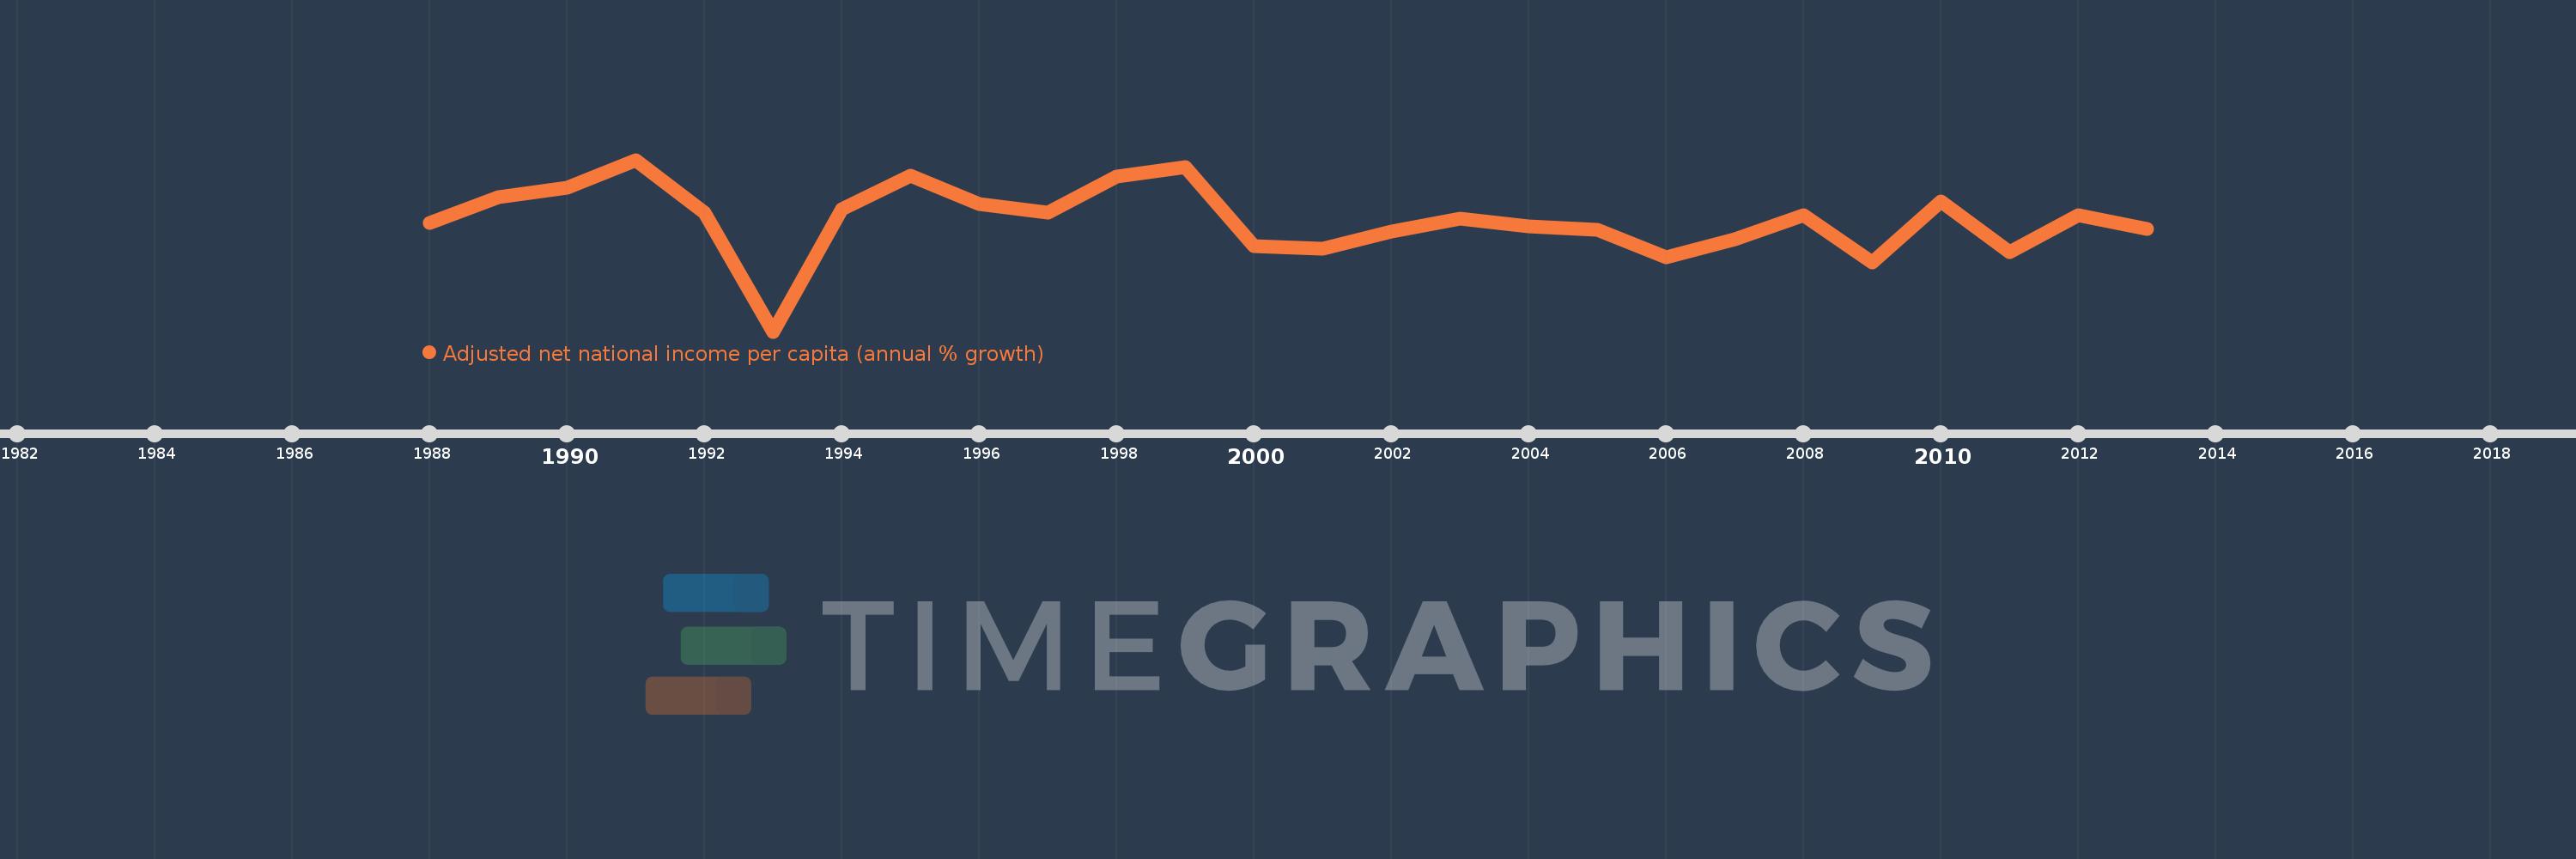
Adjusted net national income per capita (annual % growth)
2013,2012,2011,2010,2009,2008,2007,2006,2005,2004,2003,2002,2001,2000,1999,1998,1997,1996,1995,1994,1993,1992,1991,1990,1989,1988
Estas estadísticas en otros países:
línea de tiempo (timeline):
En esta escala de tiempo se presenta un gráfico de 1988 y 2013 de Barbados. Los datos de 1987 están ausentes. El número de observaciones reales por fecha: 26.
Fuente (nombre):
Indicadores del desarrollo mundial
Fuente (organización):
World Bank staff estimates based on sources and methods in World Bank's "The Changing Wealth of Nations: Measuring Sustainable Development in the New Millennium" (2011).
Categorías:
Economy & Growth
Se ha actualizado:
23 abr 2017 año
Los indicadores de los cambios de valor en los últimos años
Mínimo:
-16.429
1 ene 1993 año
Máximo:
9.72
1 ene 1991 año
A la fecha de observación
Valor
Cambio absoluto
El cambio con respecto al valor anterior
1 ene 1988 año
0.112
+0.112
0.0%
1 ene 1989 año
4.044
+3.932
3.51 mil%
1 ene 1990 año
5.474
+1.431
35.38%
1 ene 1991 año
9.72
+4.246
77.56%
1 ene 1992 año
1.659
-8.061
-82.93%
1 ene 1993 año
-16.429
-18.088
-1.09 mil%
1 ene 1994 año
2.18
+18.608
-113.27%
1 ene 1995 año
7.337
+5.157
236.62%
1 ene 1996 año
3.015
-4.322
-58.91%
1 ene 1997 año
1.674
-1.341
-44.47%
1 ene 1998 año
7.126
+5.451
325.6%
1 ene 1999 año
8.56
+1.435
20.13%
1 ene 2000 año
-3.452
-12.013
-140.33%
1 ene 2001 año
-3.8
-0.348
10.08%
1 ene 2002 año
-1.255
+2.545
-66.97%
1 ene 2003 año
0.715
+1.97
-156.95%
1 ene 2004 año
-0.393
-1.108
-154.96%
1 ene 2005 año
-0.954
-0.562
142.94%
1 ene 2006 año
-5.1
-4.145
434.3%
1 ene 2007 año
-2.367
+2.733
-53.59%
1 ene 2008 año
1.331
+3.698
-156.25%
1 ene 2009 año
-5.864
-7.196
-540.45%
1 ene 2010 año
3.379
+9.244
-157.63%
1 ene 2011 año
-4.274
-7.654
-226.48%
1 ene 2012 año
1.298
+5.572
-130.36%
1 ene 2013 año
-0.818
-2.115
-163.01%
Ranking de los países por los datos estadísticos actuales


Comentarios: