29
/es/
es
AIzaSyAYiBZKx7MnpbEhh9jyipgxe19OcubqV5w
April 1, 2024
238892
Sierra Leone
SLE
true
2
1
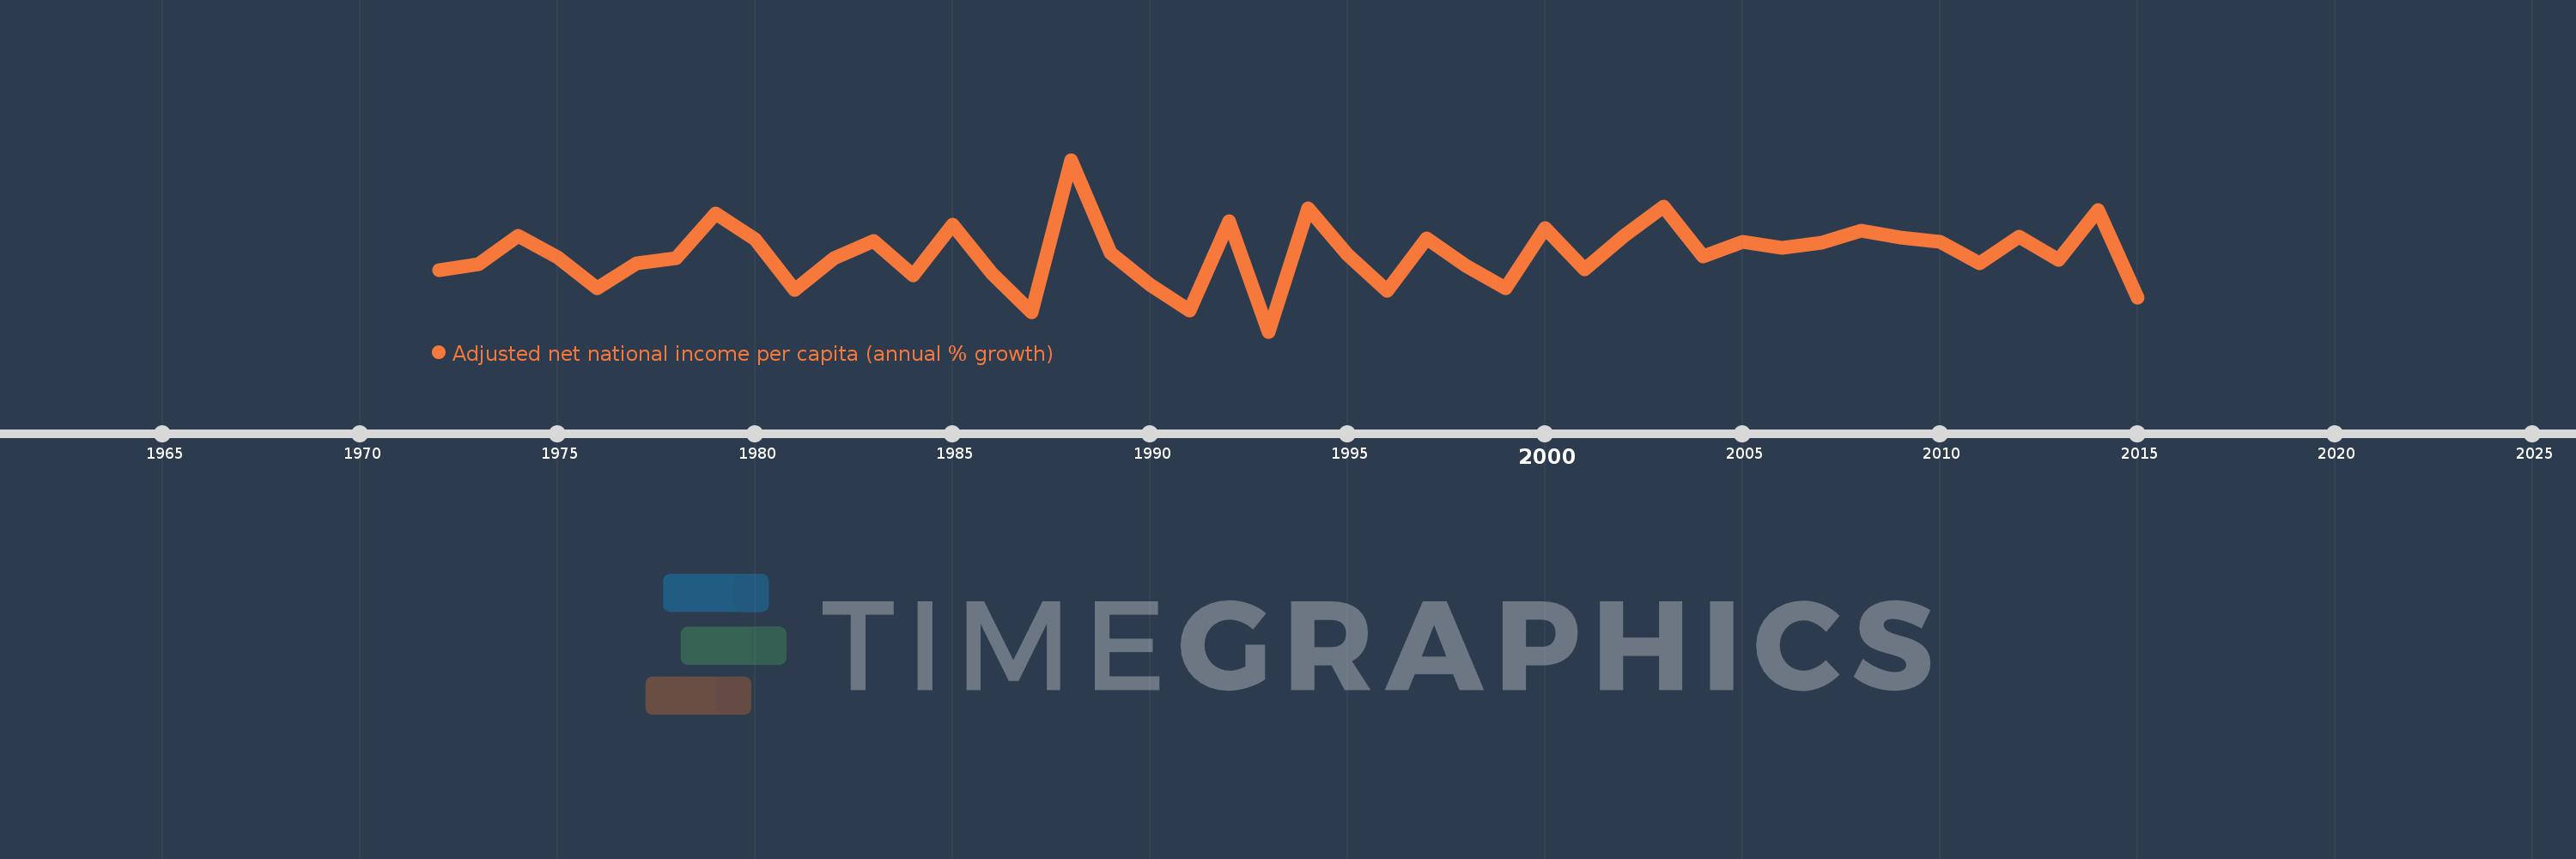
Adjusted net national income per capita (annual % growth)
2015,2014,2013,2012,2011,2010,2009,2008,2007,2006,2005,2004,2003,2002,2001,2000,1999,1998,1997,1996,1995,1994,1993,1992,1991,1990,1989,1988,1987,1986,1985,1984,1983,1982,1981,1980,1979,1978,1977,1976,1975,1974,1973,1972
Estas estadísticas en otros países:
línea de tiempo (timeline):
En esta escala de tiempo se presenta un gráfico de 1972 y 2015 de Sierra Leone. Los datos de 1971 están ausentes. El número de observaciones reales por fecha: 44.
Fuente (nombre):
Indicadores del desarrollo mundial
Fuente (organización):
World Bank staff estimates based on sources and methods in World Bank's "The Changing Wealth of Nations: Measuring Sustainable Development in the New Millennium" (2011).
Categorías:
Economy & Growth
Se ha actualizado:
23 abr 2017 año
Los indicadores de los cambios de valor en los últimos años
Mínimo:
-27.234
1 ene 1993 año
Máximo:
33.605
1 ene 1988 año
A la fecha de observación
Valor
Cambio absoluto
El cambio con respecto al valor anterior
1 ene 1972 año
-5.387
-5.387
0.0%
1 ene 1973 año
-3.422
+1.965
-36.48%
1 ene 1974 año
6.544
+9.966
-291.26%
1 ene 1975 año
-0.988
-7.532
-115.1%
1 ene 1976 año
-11.806
-10.818
1.09 mil%
1 ene 1977 año
-3.102
+8.704
-73.72%
1 ene 1978 año
-1.112
+1.991
-64.17%
1 ene 1979 año
14.664
+15.775
-1.42 mil%
1 ene 1980 año
5.465
-9.198
-62.73%
1 ene 1981 año
-12.369
-17.834
-326.31%
1 ene 1982 año
-1.181
+11.188
-90.45%
1 ene 1983 año
4.836
+6.017
-509.55%
1 ene 1984 año
-7.324
-12.16
-251.43%
1 ene 1985 año
10.518
+17.841
-243.61%
1 ene 1986 año
-6.721
-17.239
-163.91%
1 ene 1987 año
-20.427
-13.706
203.91%
1 ene 1988 año
33.605
+54.033
-264.51%
1 ene 1989 año
0.678
-32.928
-97.98%
1 ene 1990 año
-10.748
-11.426
-1.69 mil%
1 ene 1991 año
-19.8
-9.052
84.22%
1 ene 1992 año
11.958
+31.757
-160.39%
1 ene 1993 año
-27.234
-39.191
-327.75%
1 ene 1994 año
16.378
+43.612
-160.14%
1 ene 1995 año
0.09
-16.288
-99.45%
1 ene 1996 año
-12.729
-12.819
-14.26 mil%
1 ene 1997 año
5.636
+18.365
-144.28%
1 ene 1998 año
-3.939
-9.575
-169.89%
1 ene 1999 año
-11.999
-8.06
204.61%
1 ene 2000 año
9.422
+21.42
-178.52%
1 ene 2001 año
-5.314
-14.735
-156.4%
1 ene 2002 año
6.821
+12.135
-228.37%
1 ene 2003 año
16.926
+10.105
148.15%
1 ene 2004 año
-0.583
-17.509
-103.44%
1 ene 2005 año
4.405
+4.988
-855.92%
1 ene 2006 año
2.348
-2.057
-46.7%
1 ene 2007 año
4.332
+1.984
84.49%
1 ene 2008 año
8.47
+4.138
95.51%
1 ene 2009 año
6.209
-2.261
-26.69%
1 ene 2010 año
4.445
-1.764
-28.41%
1 ene 2011 año
-2.967
-7.411
-166.75%
1 ene 2012 año
6.511
+9.477
-319.47%
1 ene 2013 año
-1.735
-8.246
-126.65%
1 ene 2014 año
15.956
+17.69
-1.02 mil%
1 ene 2015 año
-15.326
-31.282
-196.05%
Ranking de los países por los datos estadísticos actuales


Comentarios: