29
/es/
es
AIzaSyAYiBZKx7MnpbEhh9jyipgxe19OcubqV5w
April 1, 2024
118594
Denmark
DNK
true
2
1
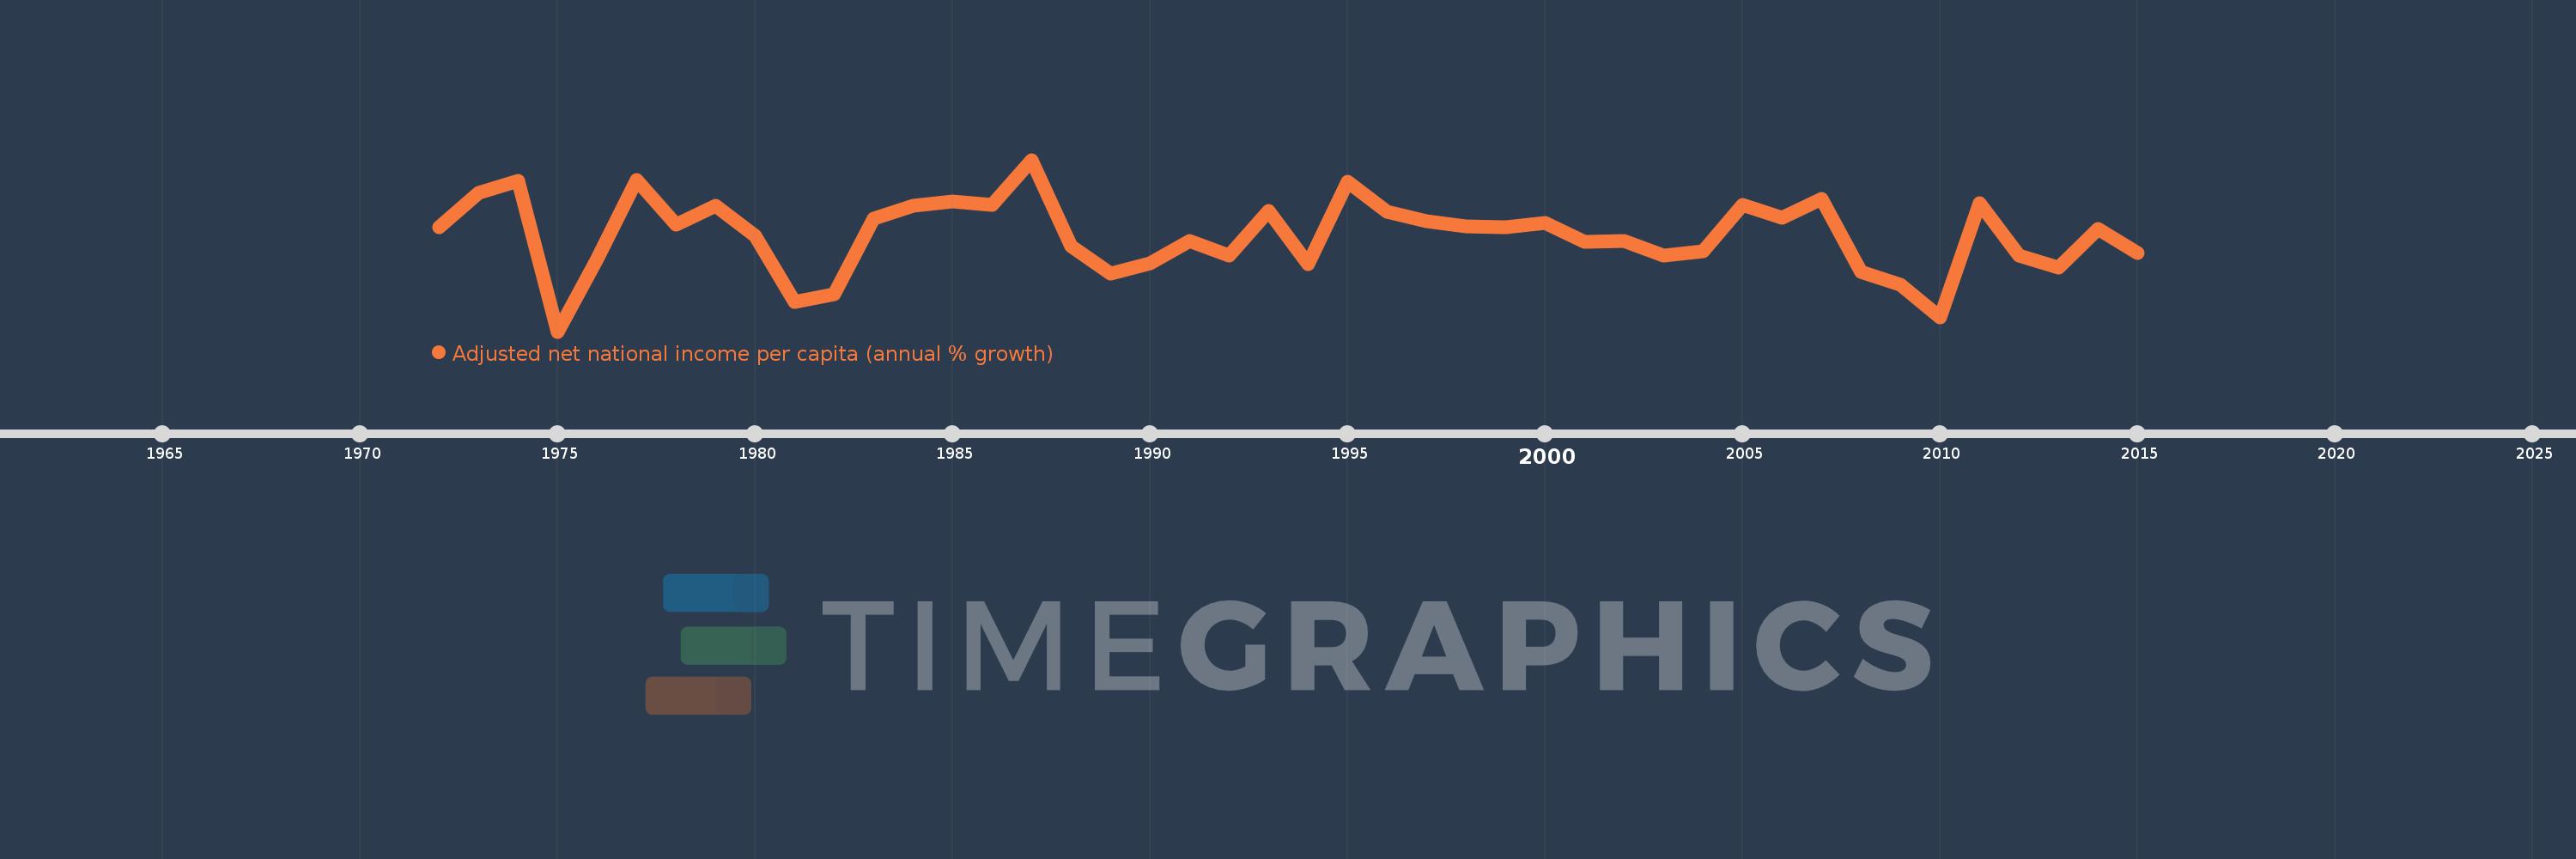
Adjusted net national income per capita (annual % growth)
2015,2014,2013,2012,2011,2010,2009,2008,2007,2006,2005,2004,2003,2002,2001,2000,1999,1998,1997,1996,1995,1994,1993,1992,1991,1990,1989,1988,1987,1986,1985,1984,1983,1982,1981,1980,1979,1978,1977,1976,1975,1974,1973,1972
Estas estadísticas en otros países:
línea de tiempo (timeline):
En esta escala de tiempo se presenta un gráfico de 1972 y 2015 de Denmark. Los datos de 1971 están ausentes. El número de observaciones reales por fecha: 44.
Fuente (nombre):
Indicadores del desarrollo mundial
Fuente (organización):
World Bank staff estimates based on sources and methods in World Bank's "The Changing Wealth of Nations: Measuring Sustainable Development in the New Millennium" (2011).
Categorías:
Economy & Growth
Se ha actualizado:
23 abr 2017 año
Los indicadores de los cambios de valor en los últimos años
Mínimo:
-5.117
1 ene 1975 año
Máximo:
6.708
1 ene 1987 año
A la fecha de observación
Valor
Cambio absoluto
El cambio con respecto al valor anterior
1 ene 1972 año
2.082
+2.082
0.0%
1 ene 1973 año
4.406
+2.325
111.66%
1 ene 1974 año
5.271
+0.865
19.63%
1 ene 1975 año
-5.117
-10.388
-197.07%
1 ene 1976 año
-0.118
+4.999
-97.7%
1 ene 1977 año
5.29
+5.408
-4.6 mil%
1 ene 1978 año
2.259
-3.031
-57.29%
1 ene 1979 año
3.522
+1.263
55.9%
1 ene 1980 año
1.487
-2.036
-57.79%
1 ene 1981 año
-3.095
-4.582
-308.21%
1 ene 1982 año
-2.561
+0.535
-17.27%
1 ene 1983 año
2.636
+5.197
-202.96%
1 ene 1984 año
3.561
+0.924
35.06%
1 ene 1985 año
3.862
+0.302
8.47%
1 ene 1986 año
3.617
-0.245
-6.35%
1 ene 1987 año
6.708
+3.091
85.45%
1 ene 1988 año
0.741
-5.967
-88.95%
1 ene 1989 año
-1.133
-1.875
-252.96%
1 ene 1990 año
-0.388
+0.745
-65.75%
1 ene 1991 año
1.101
+1.489
-383.68%
1 ene 1992 año
0.115
-0.986
-89.54%
1 ene 1993 año
3.172
+3.057
2.65 mil%
1 ene 1994 año
-0.468
-3.64
-114.77%
1 ene 1995 año
5.183
+5.652
-1.21 mil%
1 ene 1996 año
3.118
-2.065
-39.84%
1 ene 1997 año
2.502
-0.616
-19.76%
1 ene 1998 año
2.11
-0.392
-15.66%
1 ene 1999 año
2.056
-0.054
-2.55%
1 ene 2000 año
2.377
+0.32
15.57%
1 ene 2001 año
1.07
-1.307
-54.99%
1 ene 2002 año
1.1
+0.031
2.88%
1 ene 2003 año
0.11
-0.99
-89.97%
1 ene 2004 año
0.401
+0.291
263.5%
1 ene 2005 año
3.63
+3.228
804.6%
1 ene 2006 año
2.733
-0.897
-24.71%
1 ene 2007 año
4.045
+1.312
48.02%
1 ene 2008 año
-0.987
-5.033
-124.41%
1 ene 2009 año
-1.884
-0.897
90.84%
1 ene 2010 año
-4.114
-2.23
118.32%
1 ene 2011 año
3.746
+7.86
-191.06%
1 ene 2012 año
0.144
-3.602
-96.15%
1 ene 2013 año
-0.723
-0.867
-601.11%
1 ene 2014 año
1.949
+2.671
-369.69%
1 ene 2015 año
0.267
-1.682
-86.31%
Ranking de los países por los datos estadísticos actuales


Comentarios: