29
/es/
es
AIzaSyAYiBZKx7MnpbEhh9jyipgxe19OcubqV5w
April 1, 2024
86767
Bolivia
BOL
true
2
1
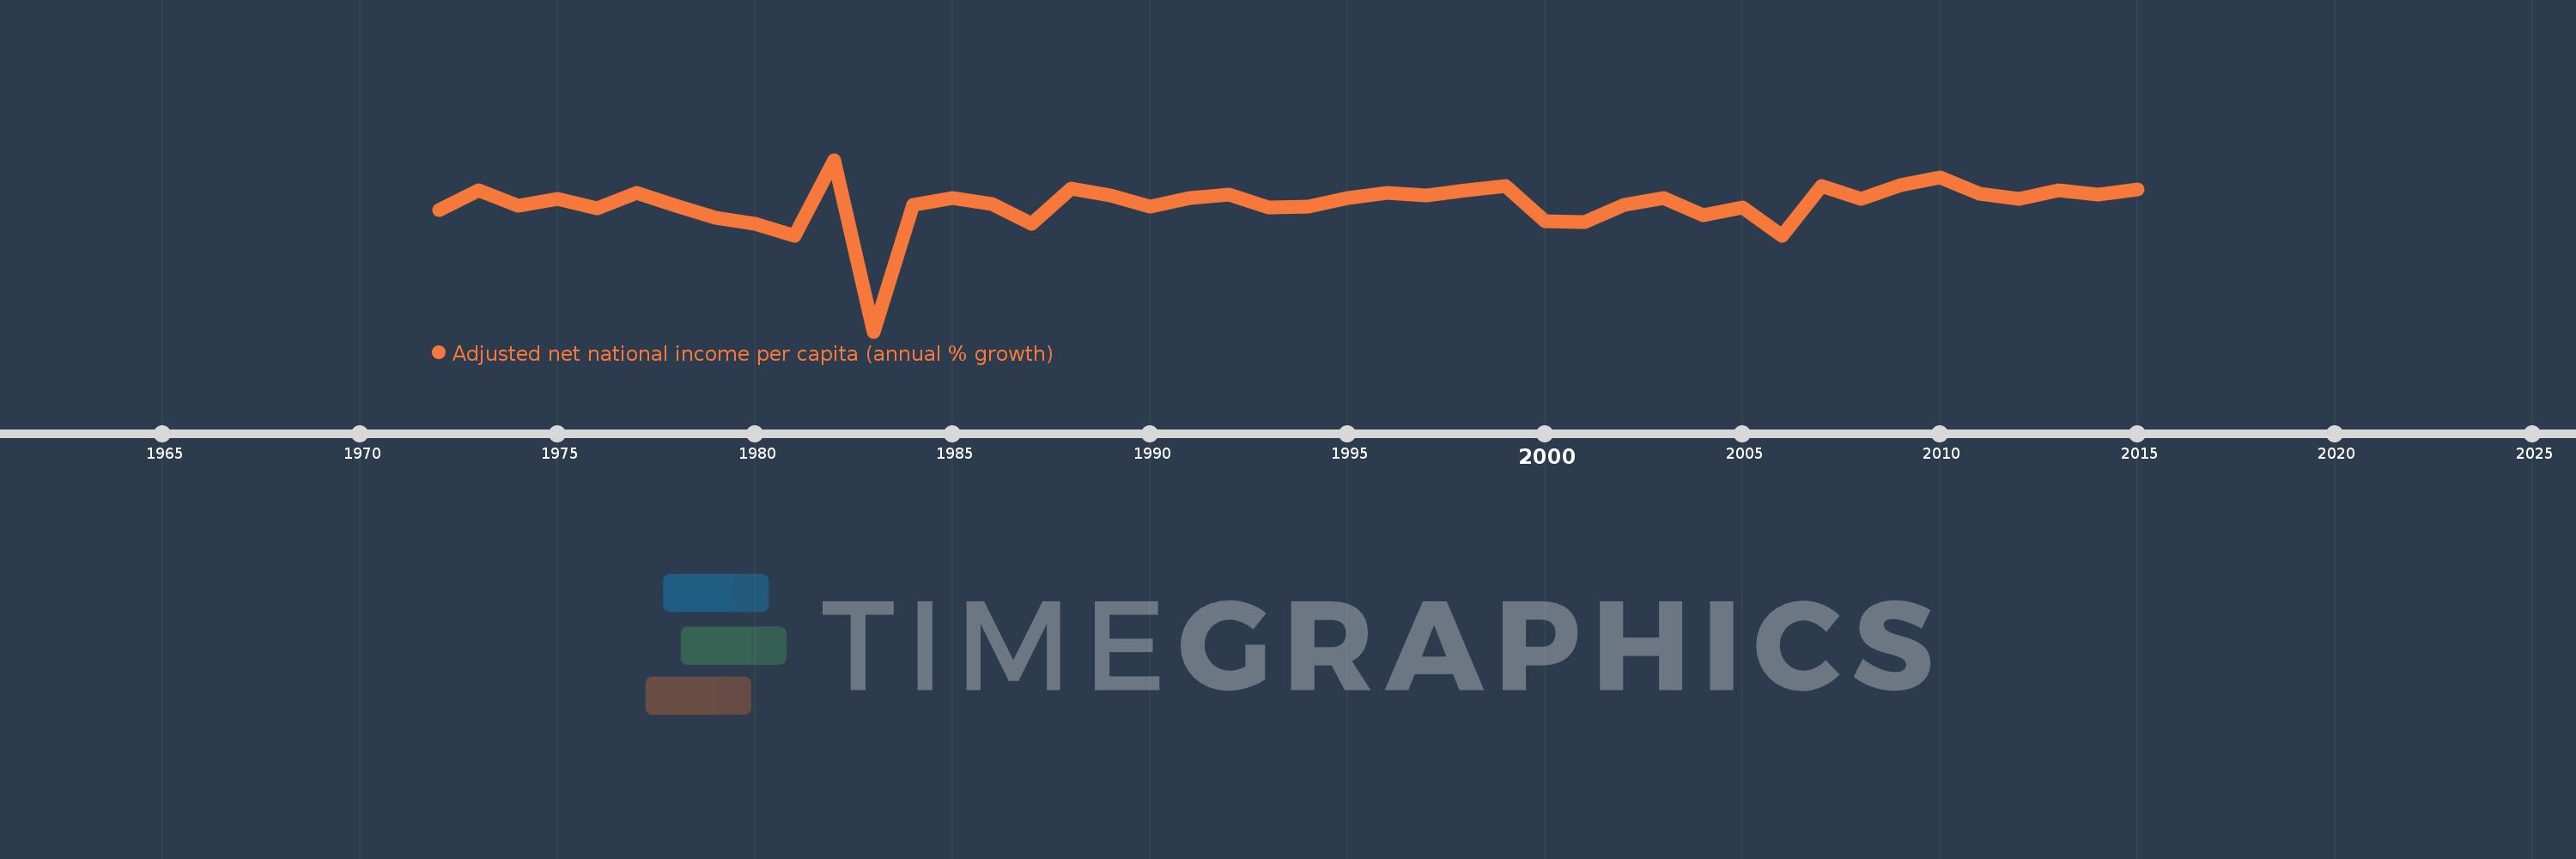
Adjusted net national income per capita (annual % growth)
2015,2014,2013,2012,2011,2010,2009,2008,2007,2006,2005,2004,2003,2002,2001,2000,1999,1998,1997,1996,1995,1994,1993,1992,1991,1990,1989,1988,1987,1986,1985,1984,1983,1982,1981,1980,1979,1978,1977,1976,1975,1974,1973,1972
Estas estadísticas en otros países:
línea de tiempo (timeline):
En esta escala de tiempo se presenta un gráfico de 1972 y 2015 de Bolivia. Los datos de 1971 están ausentes. El número de observaciones reales por fecha: 44.
Fuente (nombre):
Indicadores del desarrollo mundial
Fuente (organización):
World Bank staff estimates based on sources and methods in World Bank's "The Changing Wealth of Nations: Measuring Sustainable Development in the New Millennium" (2011).
Categorías:
Economy & Growth
Se ha actualizado:
23 abr 2017 año
Los indicadores de los cambios de valor en los últimos años
Mínimo:
-33.66
1 ene 1983 año
Máximo:
13.018
1 ene 1982 año
A la fecha de observación
Valor
Cambio absoluto
El cambio con respecto al valor anterior
1 ene 1972 año
-0.616
-0.616
0.0%
1 ene 1973 año
4.73
+5.346
-868.55%
1 ene 1974 año
0.524
-4.206
-88.92%
1 ene 1975 año
2.429
+1.905
363.34%
1 ene 1976 año
-0.128
-2.557
-105.27%
1 ene 1977 año
3.981
+4.109
-3.21 mil%
1 ene 1978 año
0.611
-3.37
-84.64%
1 ene 1979 año
-2.796
-3.407
-557.25%
1 ene 1980 año
-4.424
-1.629
58.26%
1 ene 1981 año
-7.6
-3.176
71.78%
1 ene 1982 año
13.018
+20.618
-271.29%
1 ene 1983 año
-33.66
-46.679
-358.56%
1 ene 1984 año
0.731
+34.391
-102.17%
1 ene 1985 año
2.603
+1.872
256.19%
1 ene 1986 año
0.997
-1.607
-61.72%
1 ene 1987 año
-4.355
-5.352
-536.98%
1 ene 1988 año
5.285
+9.64
-221.35%
1 ene 1989 año
3.293
-1.992
-37.69%
1 ene 1990 año
0.383
-2.91
-88.36%
1 ene 1991 año
2.645
+2.261
589.94%
1 ene 1992 año
3.68
+1.035
39.13%
1 ene 1993 año
0.029
-3.651
-99.22%
1 ene 1994 año
0.304
+0.276
963.71%
1 ene 1995 año
2.531
+2.227
731.63%
1 ene 1996 año
3.965
+1.434
56.64%
1 ene 1997 año
3.366
-0.599
-15.1%
1 ene 1998 año
4.711
+1.345
39.96%
1 ene 1999 año
5.931
+1.22
25.9%
1 ene 2000 año
-3.683
-9.614
-162.1%
1 ene 2001 año
-3.963
-0.28
7.6%
1 ene 2002 año
0.834
+4.797
-121.05%
1 ene 2003 año
2.627
+1.792
214.84%
1 ene 2004 año
-2.048
-4.675
-177.98%
1 ene 2005 año
0.139
+2.187
-106.79%
1 ene 2006 año
-7.527
-7.666
-5.51 mil%
1 ene 2007 año
5.935
+13.462
-178.85%
1 ene 2008 año
2.373
-3.562
-60.01%
1 ene 2009 año
6.028
+3.655
154.0%
1 ene 2010 año
8.24
+2.212
36.7%
1 ene 2011 año
3.915
-4.325
-52.49%
1 ene 2012 año
2.445
-1.47
-37.54%
1 ene 2013 año
4.74
+2.295
93.83%
1 ene 2014 año
3.483
-1.257
-26.52%
1 ene 2015 año
5.04
+1.557
44.7%
Ranking de los países por los datos estadísticos actuales


Comentarios: